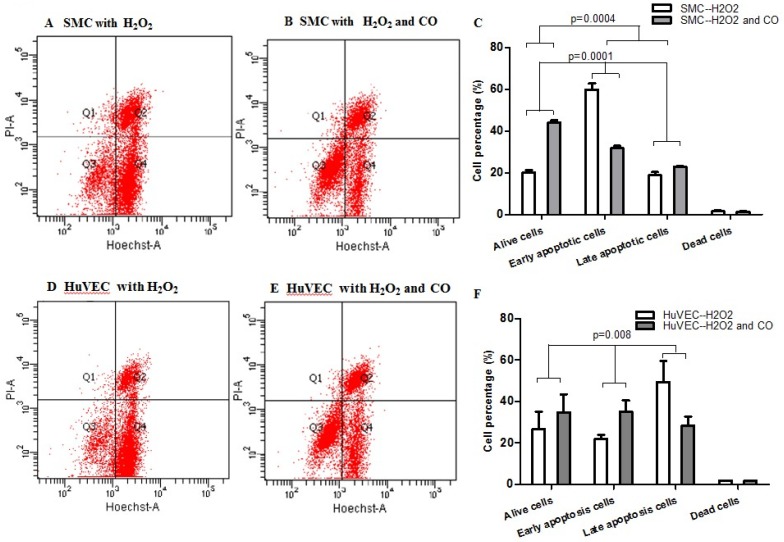
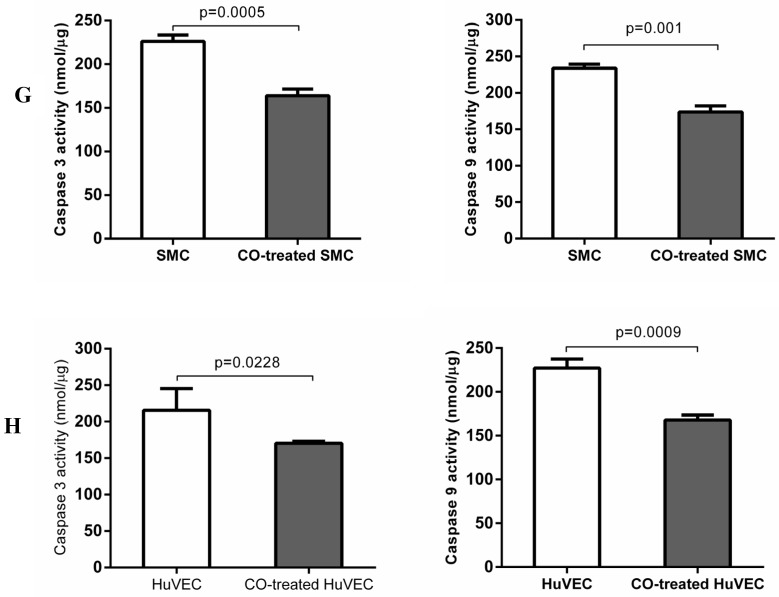
Fig 5.
Effect of CO on the apoptosis of SMC and HuVEC caused by hydrogen peroxide (H2O2). Representative flow cytometric analysis on SMC and HuVEC stained with Hoechst staining and propidium iodide (PI) in the presence and absence of 250 ppm CO with 0.4 mM H2O2 treatment for 16 h. In each panel, “Q1” stands for “dead cells”. “Q2” stands for “late apoptotic cells”. “Q3” stands for “live cells”. “Q4” stands for “early apoptotic cells”. (A) Representative flow cytometric analysis on SMC in live stage, apoptotic stage and dead stage after SMC treated with 0.4 mM H2O2 for 16 h. (B) Representative flow cytometric analysis on SMC in live stage, apoptotic stage and dead stage after SMC treated with 0.4 mM H2O2 and 250 ppm of CO for 16 h. (C) There was a significant difference in cell percentage in live cells (Q3), early apoptotic (Q4) and late apoptotic cells (Q2) between SMC with H2O2 treatment and SMC with H2O2 and CO treatment (p=0.0001). And a significant difference in cell percentage in live cells (Q3) and apoptotic cells (Q2+Q4) between SMC with H2O2 treatment and SMC with H2O2 and CO treatment was also observed (p=0.0004). (D) Representative flow cytometric analysis on HuVEC in live stage, apoptotic stage and dead stage after HuVEC treated with 0.4 mM H2O2 for 16 h. (E) Representative flow cytometric analysis on HuVEC in live stage, apoptotic stage and dead stage after HuVEC treated with 0.4 mM H2O2 and 250 ppm of CO for 16 h. (F) There was a significant difference in cell percentage in live cells (Q3), early apoptotic cells (Q4) and late apoptotic cells (Q2) between HuVEC with H2O2 treatment and HuVEC with H2O2 and CO treatment (p=0.008). The live HuVEC in H2O2 and CO treatment group was higher than that HuVEC with H2O2 treatment. (G) Caspase 3 and 9 activities in cell lysates of SMC treated with H2O2 for 16 h. Caspase 3 and 9 activities were decreased in SMC exposed to CO with H2O2 treatment compared with SMC (n=3, p<0.05). (H) Caspase 3 and 9 activities in cell lysates of HuVEC treated with H2O2 for 16 h. Caspase 3 and 9 activities were decreased in HuVEC exposed to CO with H2O2 treatment compared with HuVEC (n=3, p<0.05). Values are expressed as mean±SEM.


