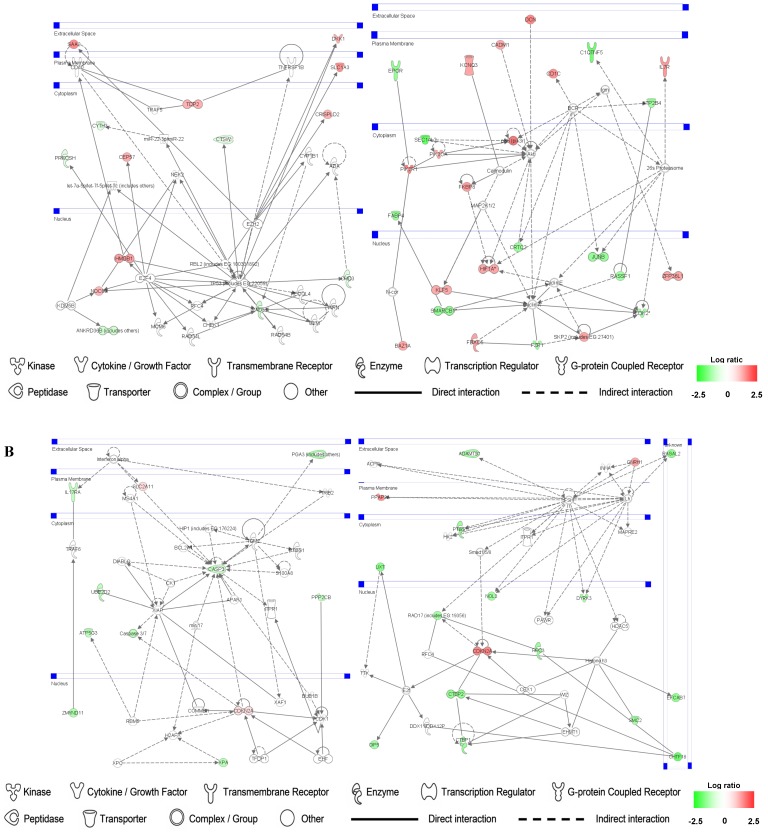
Fig 7.
Gene networks involved in CO-treated SMC and HuVEC. Red and green respectively represent up-regulated and down-regulated genes in SMC and HuVEC after exposure to CO. The regulation extents are based on the color grade. (A) Network about cell death, cell cycle and cell growth involved in CO-treated SMC compared with SMC. (B) Network about cell death, cell cycle, cell growth and proliferation involved in CO-treated HuVEC compared with HuVEC.

