Figure 6.
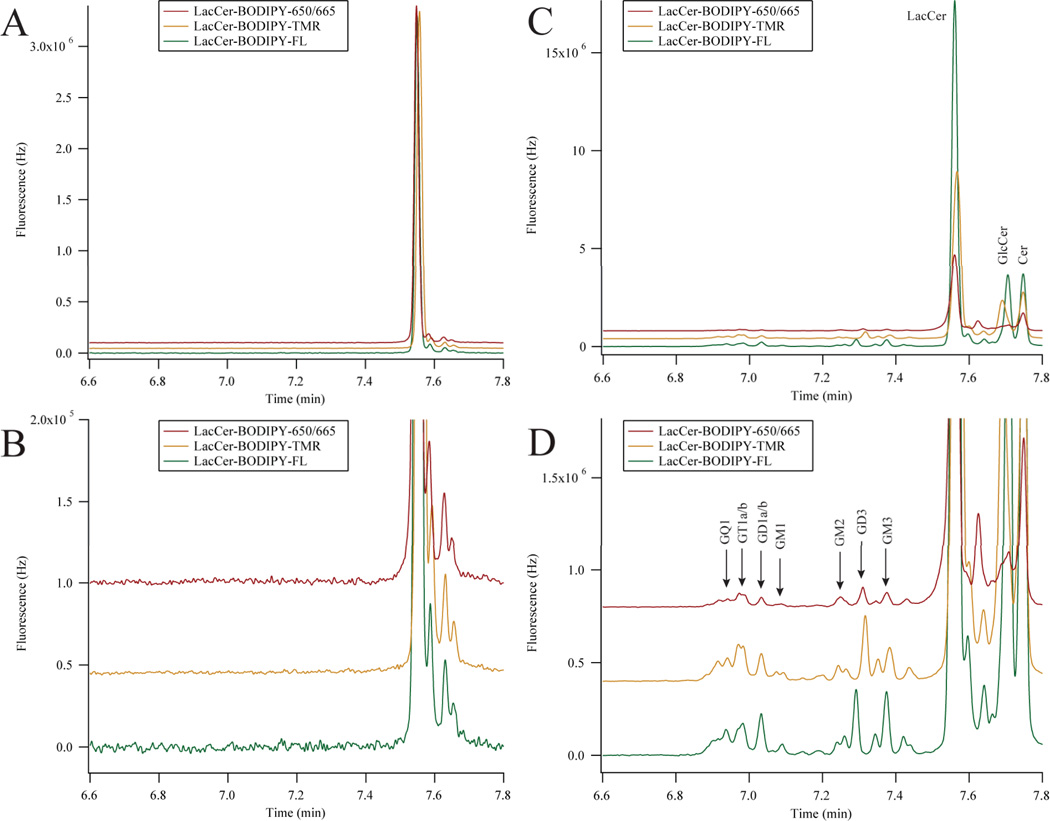
Three-color metabolic cytometry in dPC12 cells. A) Three-color electropherogram of a 3.3 nM dilution of the incubation medium containing LacCer-BODIPY-FL, LacCer-BODIPY-TMR, and LacCer-BODIPY-650. B) Blowup of the relevant portion of A). C) Three-color electropherogram of cellular homogenate after fluorescent-GSL incubation. D) Expansion of the relevant portion of C). BODIPY-FL and BODIPY-650/665 traces were multiplied by 7.7 and 2.9 (respectively) in all panels and traces were vertically offset for clarity. Electropherograms in C) and D) were aligned for analyte identification. Peak assignments were made according to the text.

