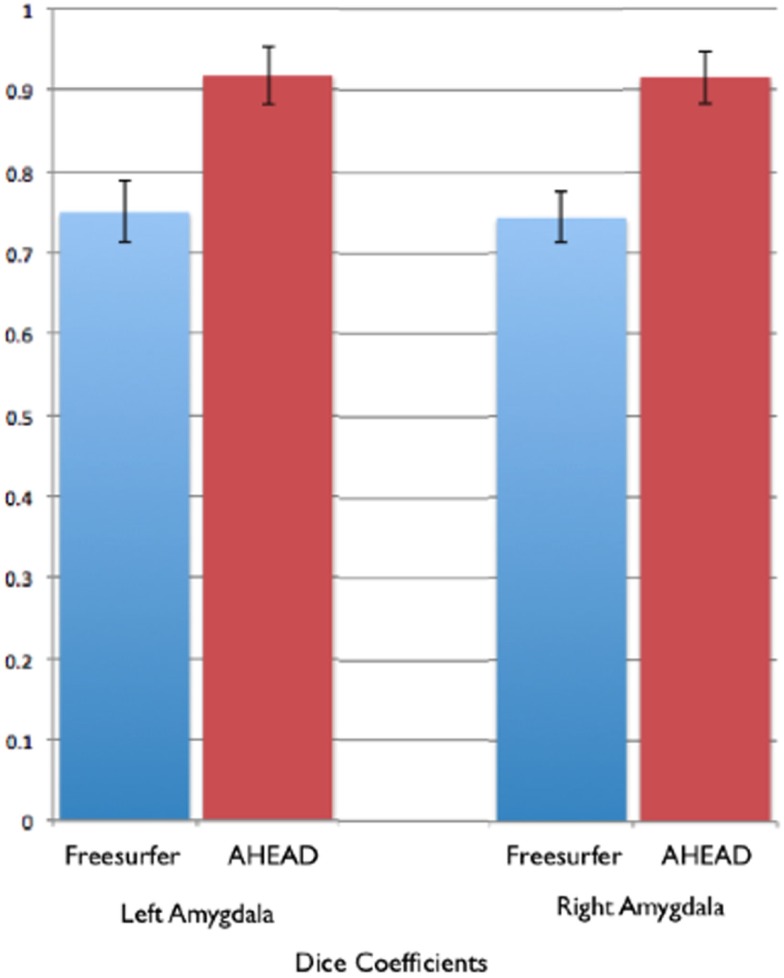
Figure 9.
Shows bar graphs of the spatial statistics (Dice coefficients) for automated amygdala using the AHEAD processing pipeline (in red) and for Freesurfer (in blue). These spatial statistics were generated by examining the amount of spatial overlap between automated amygdala segments generated by each, compared to our rigorous hand-tracing amygdala routine.

