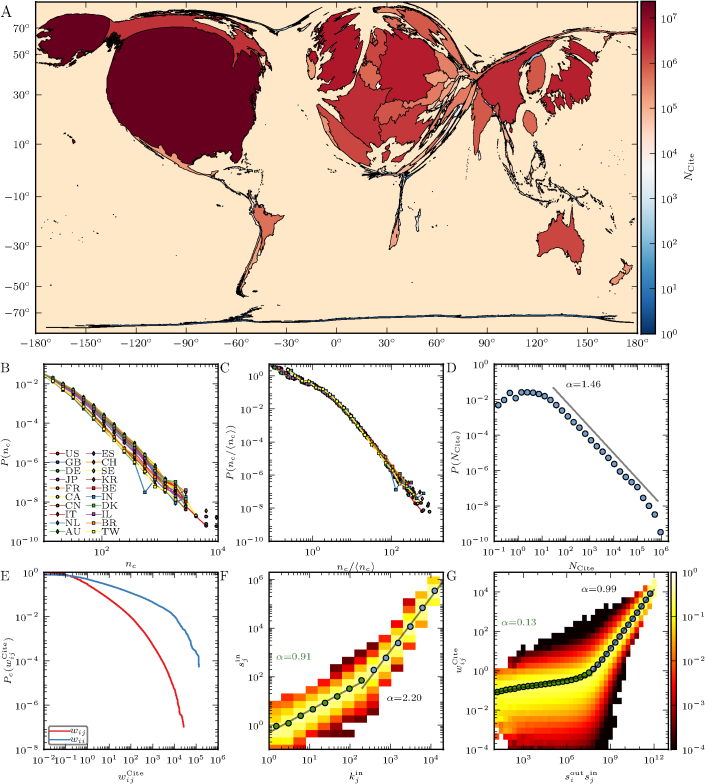
Figure 1. Properties of the world citation network.
(A) Citation map of the world where the area of each country is scaled and deformed according to the number of citations received, which is also represented by the color of each country. (B) Citation distribution of papers of top 20 countries. If a paper is written by authors from multiple countries, the paper contributes to each country. (C) When the distributions in (B) are normalized by the average number of citations of each country, they fall on top of each other. (D) Probability distribution function of the number of citations received by each city. (E) Cumulative distribution function of the link weights wij (excluding self-links) and self-links wii in the citation network of cities. (F) Node in-strength against its in-degree for the city citation network. (G) Link weight against the product of the strengths of the connected nodes in the city citation network. For each plot we show the corresponding best-fit lines and power law exponents.

