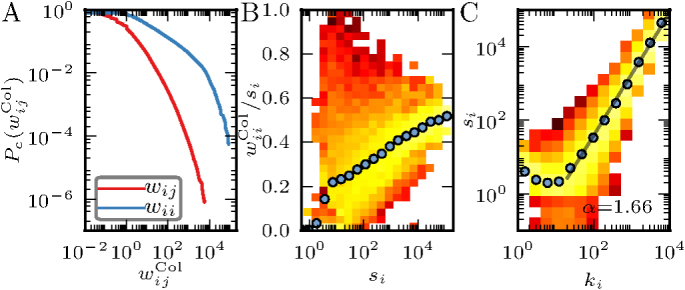
Figure 2. Properties of the world collaboration network.

(A) Cumulative probability distribution of the link weights in the collaboration network of cities. Self-links are shown separately. (B) Fraction of internal collaboration, indicated by the ratio of the weight  of the self-link and strength si of a node, against si. (C) Strength of a node against its degree. The straight line indicates a power law behavior with exponent 1.66 ± 0.04. In these plots we use the same colorbar as in Fig. 1.
