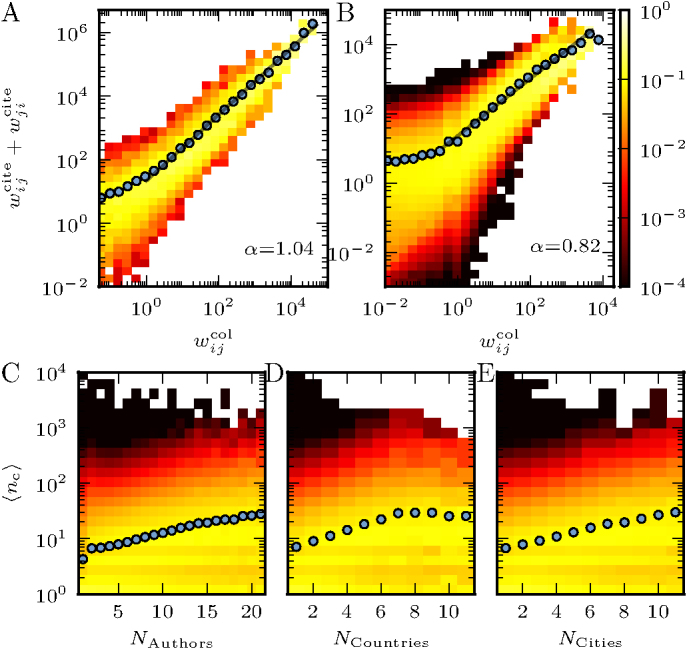
Figure 3. Correlation between the world citation and collaboration networks.

Weight of the links in the citation network against the corresponding links in the collaboration network at the (A) country level and (B) city level network. Power law scaling is shown by solid lines with exponents 1.04 ± 0.01 and 0.82 ± 0.02, respectively. Density plot of the number of citations of a publication against the number of (C) co-authors, (D) countries (E) cities in the affiliation. The circles indicate the average trend.
