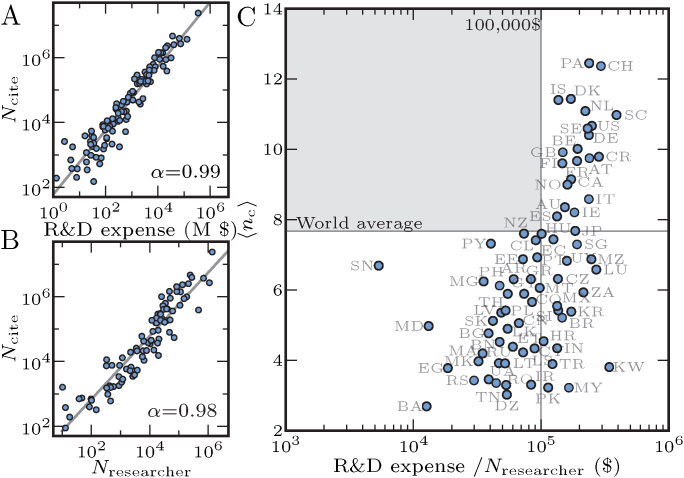
Figure 5. Relation between research outcome and funding.
Average number of citations per paper of a country against (A) the expenditure in research and development (in millions of dollars per year, and purchasing power parity) and (B) the number of researchers in that country. The solid line indicates power law scaling with exponent 0.99 ± 0.03 and 0.98 ± 0.04, respectively. (C) Average number of citations per paper of a country against the average spending per researcher. The horizontal line indicates the average number of citations over all papers of all countries, the vertical line indicates the threshold of about 100,000 $ per researcher per year.

