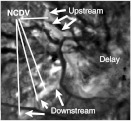
Fig. 16.
Revealing upstream/downstream portions of the NCDV: Fill-time image before treatment. The NCDV location is identifiable because it is darkened in Fig. 15(b). To identify it, this image was overlaid onto Fig. 15(b) and the video display was toggled between the images. Once located, we see which are the upstream or downstream portions because there is longer delay (brighter) downstream. The dispersion image appears virtually identical to this image, which could be because the mixing and thereby the dispersion will increase over the time course and thereby increase with travel downstream in the network.

