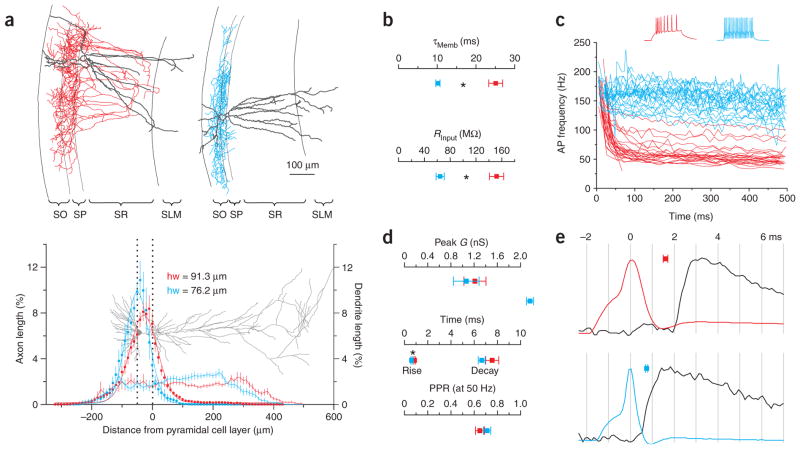
Figure 2.
Characterization of morphological, intrinsic and synaptic properties of CB1R-positive and -negative basket cells. (a) Top, reconstructions of CB1R-positive (left; red, axon; gray, dendrite) and -negative (right; blue, axon; gray, dendrite) basket cells shown in Figure 1a (all reconstructed cells are illustrated in Supplementary Fig. 1). SO, stratum oriens; SP, stratum pyrimidale; SR, stratum radiatum; SLM, stratum lacunosum-moleculare. Bottom, axonal (squares; n = 16 and 11) and dendritic (thin lines; n = 13 and 11; dotted lines represent SP; gray pyramidal cell for reference) density distributions of reconstructed basket cells. Axonal distributions are fit by Gaussians (thick lines; hw = half width). (b) Summary of membrane time constant (top) and input resistance (bottom) for CB1R-positive (red; n = 18 and 22) and -negative (blue; n = 22 and 26) basket cells. Asterisks represent statistical significance (P < 0.0001). (c) Instantaneous spike frequency of CB1R-positive (n = 28) and CB1R-negative (n = 26) basket cells in response to depolarizing current pulses. Voltage traces from cells in a. (d) Summary graphs of peak conductance (top), rise time and decay time constant (middle), and paired pulse ratio (50 Hz, bottom) of uIPSCs evoked by CB1R-positive (red; n = 28, 26, 24 and 21) and -negative (blue; n = 26, 24, 23 and 12) basket cells. (e) Action potentials from cells in a and corresponding uIPSC in the postsynaptic pyramidal cell (black) on an expanded time scale (vertical lines are separated by 1 ms). Squares, average latencies (between action potential peak and uIPSC onset) for CB1R-positive (top, n = 27) and -negative (bottom, n = 24) basket cells.

