Figure 6.
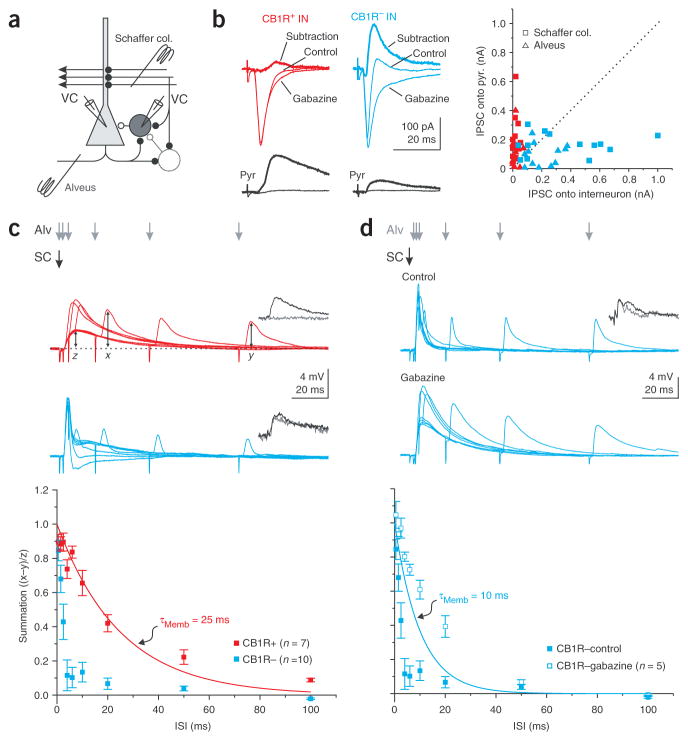
Distinct integration time windows in CB1R-positive and -negative basket cells. (a) Recording configuration. (b) Left, current traces from CB1R-positive and -negative basket (top) and pyramidal cell (bottom) pairs in response to alveus stimulation in control and gabazine, and the algebraic subtraction of the traces (thick line). CB1R-positive cell is the same as that in Figure 1b. Right, scatter plot of IPSCs onto paired basket and pyramidal cells elicited by Schaffer collateral (n = 11 and 13 for CB1R-positive and -negative basket cells, respectively) and alveus (n = 12 for both CB1R-positive and -negative basket cells) stimulation. (c) Top, superimposed average voltage traces from basket cells in response to Schaffer collateral stimulation (black arrow) followed, with increasing delays, by alveus stimulation (gray arrows). Data from same cells as those in b. Bottom, summation is computed as the peak amplitude of the summed response (x) minus the peak amplitude of the feedback postsynaptic potential (PSP) alone (y), normalized by the peak of the feedforward PSP (z). The result is plotted against the interstimulus interval (ISI) for CB1R-positive and -negative basket cells. Red line, membrane time constant of CB1R-positive basket cells. (d) Top, superimposed average voltage traces from a CB1R-negative basket cell in control and in the presence of gabazine for the same protocol as in c. Bottom, summation is plotted against the ISI in control (same data as in c) and in gabazine. Blue line, membrane time constant of CB1R-negative basket cells.

