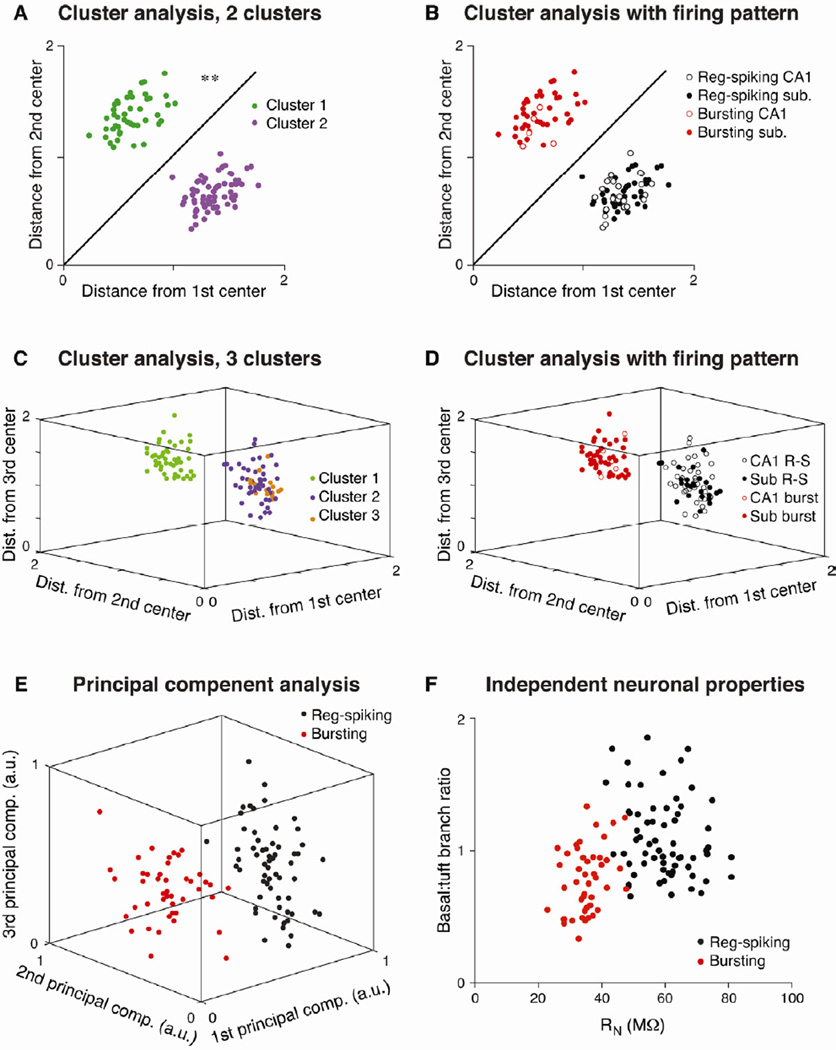
Figure 2. Two distinct classes of hippocampal pyramidal neurons.
K-means cluster analysis assigns neurons to k groups based on the Euclidian distance of all parameters from the center of each of the k clusters (n = 110 cells). A. Plot of total distance from the center of two clusters (based on 15 electrophysiological and morphological parameters) reveals significant separation into two groups. Parameters directly related to bursting (e.g., spike frequency) were excluded from the cluster analysis. B. These two groups of cells align perfectly with the regular-spiking and bursting patterns, as every cell in the purple cluster displayed regular spiking and every cell in the green cluster displayed bursting. C. Distribution of cells into three clusters. Note the lack of separation between the orange and purple clusters (2 and 3), while the green cluster (1) is significantly separated from both. D. Similarly, when all cells are grouped into 3 clusters, separation is only apparent between regular-spiking and bursting neurons. E. A principal component analysis was performed on the same 15 electrophysiological and morphological properties, and a plot of the first three principal components shows complete separation between regular-spiking and bursting neurons. F. Qualitatively similar (but incomplete) separation between regular-spiking and bursting neurons is observed by plotting two independent parameters: input resistance and the ratio of basal to tuft dendritic branch points. Asterisks indicate significant differences between the groups (** p < 0.01).

