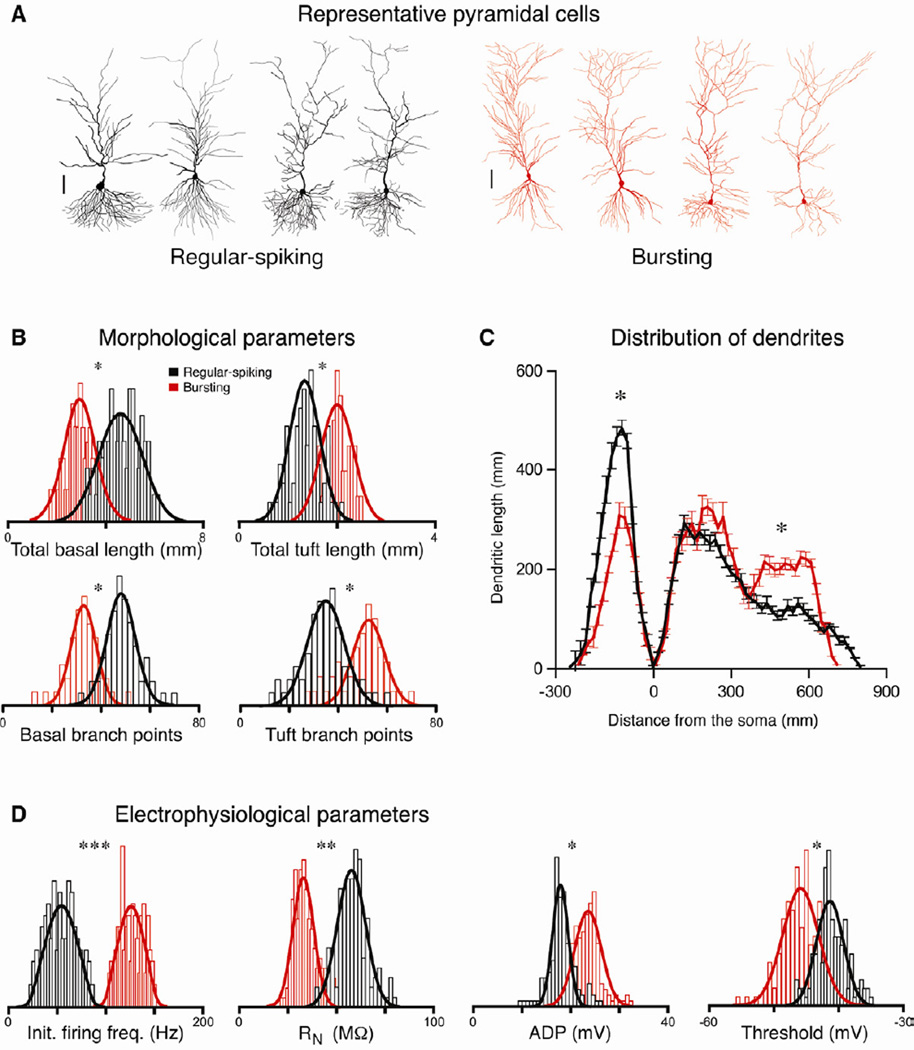
Figure 3. Morphological and physiological differences between pyramidal cell types.
A. Representative reconstructions of regular-spiking (black) and bursting (red) neurons (scale bar = 100 µm). B. Histograms of the distribution of several morphological properties (n = 110 cells) and Gaussian fits of regular-spiking (black) and bursting (red) neurons. C. Distribution of dendrites by region. Plot is dendritic length as a function of distance from the soma in 20 µm segments. Negative distance denotes basal dendritic length; positive distance denotes apical length. Note that regular-spiking neurons have longer, more extensively branched basal dendrites, whereas bursting neurons have longer, more extensively branched tuft dendrites (those in the most distal third of the apical tree). There are no differences in the total dendritic length in the proximal and middle thirds of the apical dendritic tree. D. Histograms of the distribution of several electrophysiological (n = 268) properties for the two cell types. Asterisks indicate significant differences between the groups (*p < 0.05, ** p < 0.01, *** p < 0.001).

