
FIG 2 .
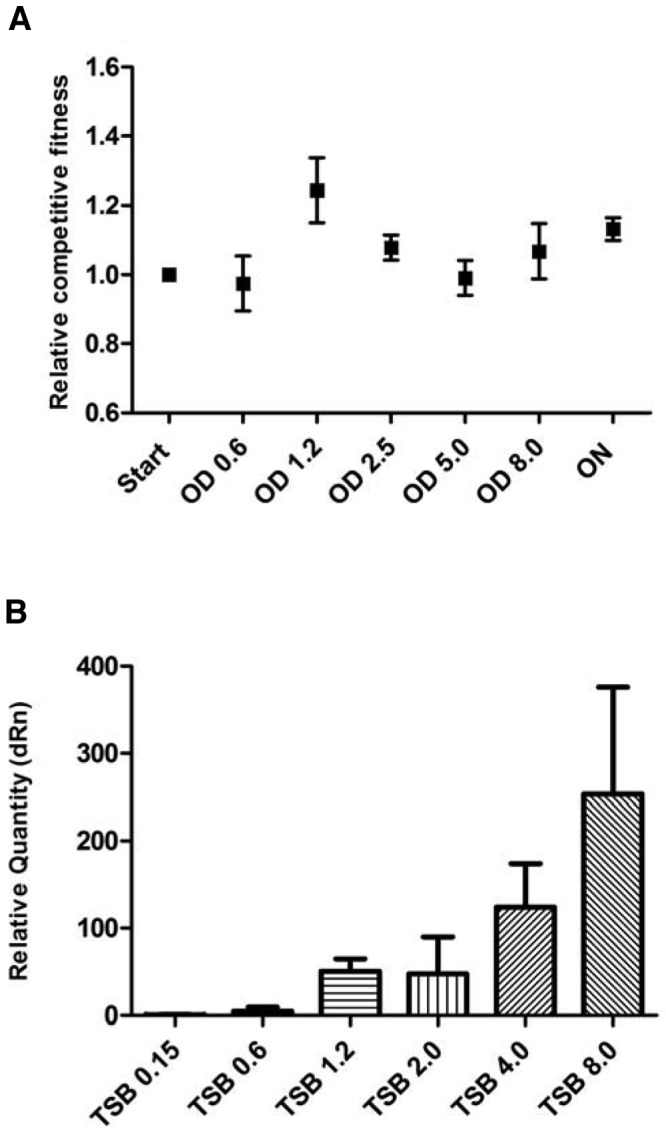
Effect of agr status on the competition ratio at various cell ODs. (A) Competitive fitness of the ΔagrA mutant relative to that of the WT grown in TSB as a function of OD with the last sampling point after 24 h of incubation. (B) RNAIII expression levels of WT cells in TSB normalized to the expression level of RNAIII at an OD of 0.15. Means with error bars indicating 95% confidence intervals are presented. ON, 24 hours; dRn, baseline subtracted fluorescent reading normalized to the reference dye.