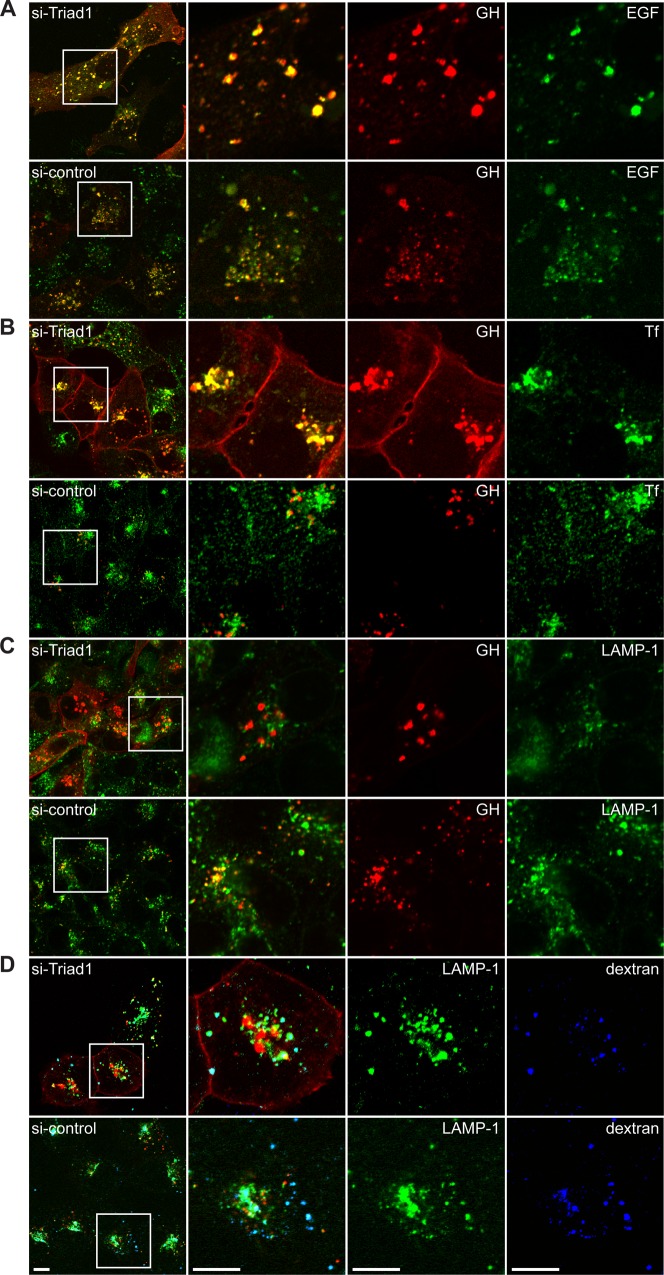
Fig. 1. Effect of Triad1 depletion on EGF, GH, Tf and dextran.
(A) U2OS cells expressing GHR and EGFR were depleted for Triad1, incubated with cy3-GH (red) and Alexa-488 EGF (green) for 30 min, and the labels were visualized by confocal microscopy. (B) U2OS cells expressing GHR were depleted as in A and incubated with cy3-GH (red) for 30 min and chased for 30 min in presence of Alexa-488 Tf (green). (C) Cells as in B were incubated with cy3-GH (red) for 30 min, chased for 15 min and fixed. Permeabilized cells were incubated with anti-LAMP-1 antibodies and Alexa 488 (green), goat-anti-mouse antibodies. (D) Cells as in B were incubated with 647-dextran (blue) for 2 h, chased with cy3-GH (red) for 30 min, followed by a second chase without any fluorescent probe, stained with LAMP-1 antibodies (green) as in C. At the left side low resolution overviews are presented, at the right side phenotypic parts (boxed) of cells are enlarged to demonstrate the differences between the silencing effects of Triad1. Scale bars represent 10 µm. All data in this figure are representatives of three independent experiments.

