
Fig. 3. Ultrastructural characterization of the Triad1-depleted phenotype.
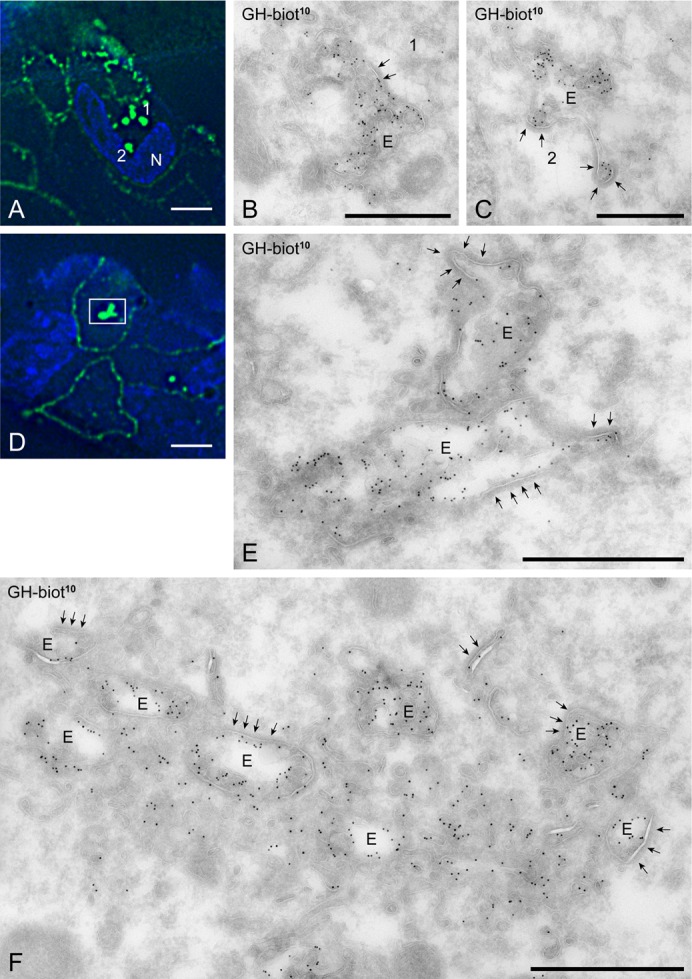
(A,D) U2OS cells were silenced for Triad1 for 3 days, incubated for 30 min with GH-biotin, fixed and prepared for ultrathin cryosectioning and labeling with anti-biotin. The anti-biotin antibody was subsequently marked with both Alexa488 and PAG10 to allow correlative microscopy. The large fluorescent spots identified in A (1 and 2) and D (square) are typically induced by Triad knockdown. Bars: 10 μm. (B,C) Applying correlative immune electron microscopy (for intermediate step in the procedure, see supplementary material Fig. S1), the fluorescent spots 1 and 2 shown in A were identified as endosomal vacuoles (E) with many ILVs, prominent bi-layered clathrin coats (arrows) and heavy labeling for GH-biotin (PAG10). (E) The bright fluorescent spot in D was found to consist of two closely apposed endosomes. (F) Example of a large cluster of endosomes induced by Triad knockdown. The endosomes are surrounded by many vesicular and tubular membrane profiles. Bars: B, 600; C, 500; E, 800; F, 800 nm.