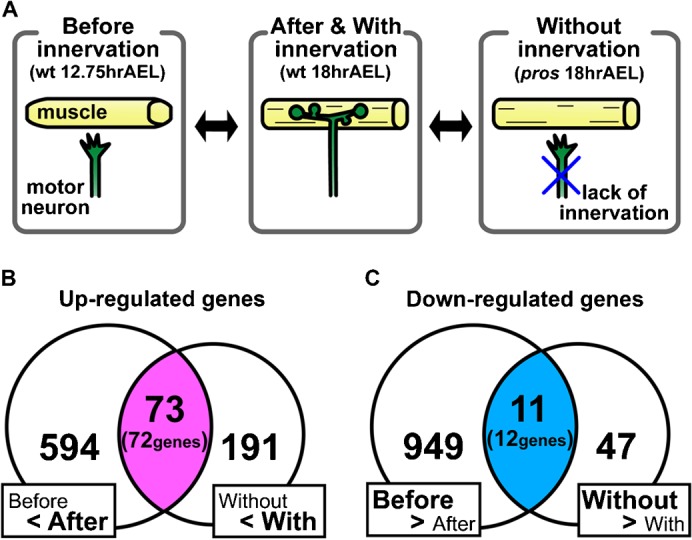
Fig. 1. Microarray analyses of genes whose expression is regulated by innervation during synaptogenesis.

(A) Schematic drawings of the experimental design. (B,C) Venn diagrams showing the number of probe sets that displayed similar or differential regulation in two series of gene expression comparative analyses. For the probe sets that displayed similar regulation in the two comparisons, the number of the corresponding genes is also shown in parenthesis.
