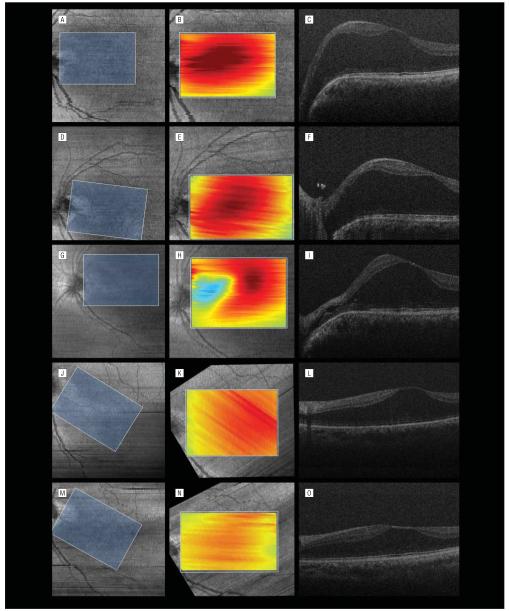
Figure 2.
Serial volumetric analysis of overlapping macular areas with spectral-domain optical coherence tomography (SD-OCT). A, D, G, J, and M, The first column shows summed voxel projections with corresponding overlapping areas (blue rectangles). The summed voxel projections are rotated because of varied orientations of the handheld SD-OCT probe. B, E, H, K, and N, In the second column, each summed voxel projection is rotated to align with the overlapped area. Included in the overlapped area is the overlay of a tomographic map of the volumetric analysis. Red corresponds to the highest retinal thickness; blue, the lowest retinal thickness. C, F, I, L, and O, The third column shows corresponding B-scans taken at the various times. A-C, Preoperative SD-OCT imaging with significant diffuse macular thickening, more prominent on the nasal side of the fovea. D-F, Intraoperative SD-OCT imaging following elevation of the posterior hyaloid. Prominent nasal elevation and diffuse retinoschisis are present with residual hyaloidal elements present at the optic nerve. E, The thickness map is similar to the preoperative scan. G-I, Intraoperative SD-OCT imaging following air-fluid exchange with aspiration over the optic pit. H and I, Imaging is performed after refilling the eye with fluid. Collapse of the schisis in the nasal aspect of the macula is noted following aspiration, verifying aspiration of intraretinal fluid. H, The thickness map demonstrates decreased retinal thickening in the peripapillary region. J-L, Postoperative SD-OCT imaging at 1 month revealing decreased foveal height and macular retinoschisis with some nasal redistribution of the fluid from the temporal macula. M-O, Postoperative SD-OCT imaging at 9 months revealing continued resolution of the intraretinal fluid.

