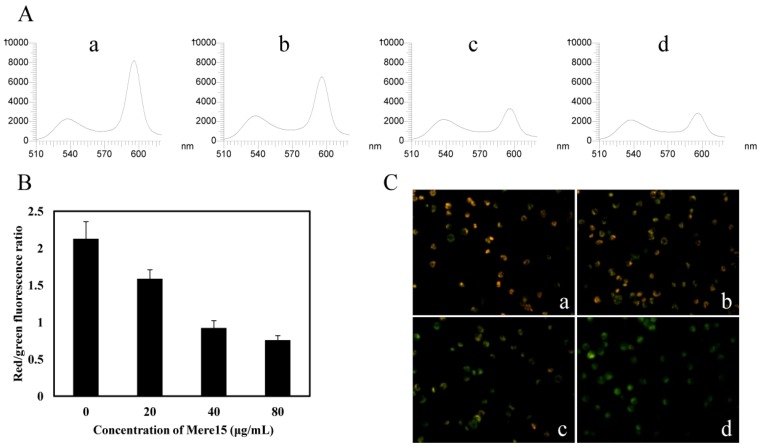
Figure 4.
Mere15 induces the loss of MMP in K562 cells. (A) JC-1 fluorescence in K562 cells untreated (a) or treated with 20 (b), 40 (c), and 80 μg/mL (d) were analyzed by fluorescence spectrophotometer. The first peak represents the green fluorescence (JC-1 monomer, Excitation 514 nm, Emission 529 nm) intensity and the last peak represents the red fluorescence (JC-1 aggregates, Excitation 585 nm, and Emission 590 nm) intensity. (B) Histograms shows ratio of red to green fluorescence intensity of cells treated with various concentrations of Mere15. Values represent the means ± SD. (C) Representative merged red-green fluorescent images of JC-1 in K562 cells untreated (a) or treated with 10 (b), 20 (c), and 40 μg/mL (d) Mere15 for 24 h, respectively.

