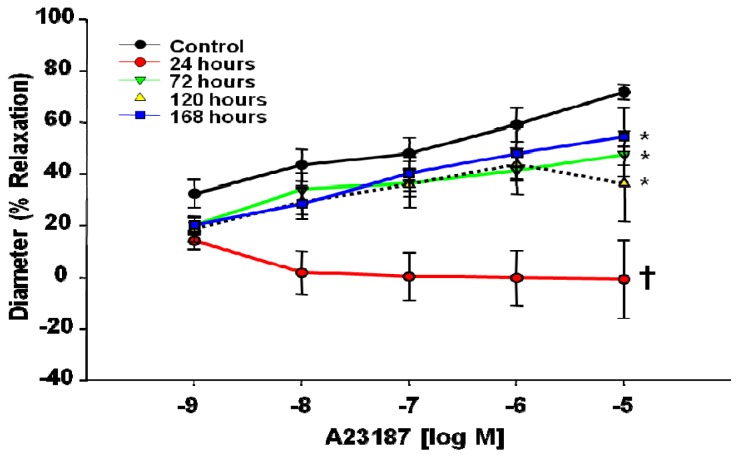
Figure 4.
A23187 time-course dose response curve 24–168 h after control (n = 6 rats) or MWCNT inhalation (n = 6–12 rats). Values are mean ± SE. *p < 0.05 vs. Control. † indicates p < 0.05 24 h compared to all other groups. Time course of impaired endothelium-dependent dilation in coronary arterioles after MWCNT inhalation.

