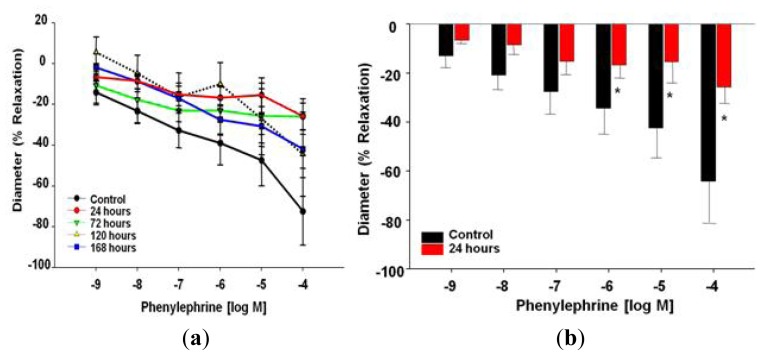
Figure 6.
(a) Phenylephrine time-course dose response curve 24–168 h after control (n = 8 rats) or MWCNT inhalation (n = 7–9 rats). Values are mean ± SE. Time course evaluation does not reveal any significant differences between control and MWCNT exposed rats. (b) Responsiveness to phenylephrine of control (n = 8 rats) vs. MWCNT (24 h post-inhalation; n = 7 rats) coronary arteriolar smooth muscle. Values are mean ± SE. There are significant differences between control and rats exposed to MWCNT via inhalation after 24 h at the highest concentrations of PE.

