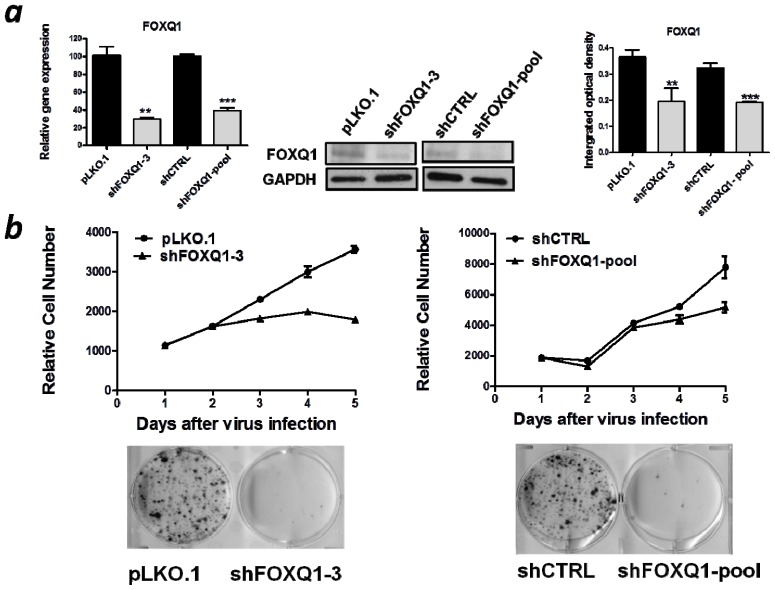
Figure 2.
Growth inhibition of SKOV3 cells after FOXQ1 knockdown. (a) qRT-PCR (left) and western blots (middle) were performed to verify the knockdown efficiencies of the two FOXQ1 shRNA lentiviruses in SKOV3 cells. Relative mRNA levels were determined using glyceraldehyde-3-phosphate dehydrogenase (GAPDH) for data normalization. GAPDH protein expression was used as a loading control in the western blot analysis. The bar graphs (right) indicate the relative density of the FOXQ1/GAPDH western blot band signals measured by using the Image J software. (**p < 0.01, ***p < 0.001). (b) Growth curve analysis (upper panel) showed that inhibition of FOXQ1 using both shRNA approaches significantly decreased cellular proliferation compared with that of the control groups. Anchorage-dependent colony formation assay (lower panel) showed marked reduction in the number of colonies in the FOXQ1 knockdown SKOV3 cells.

