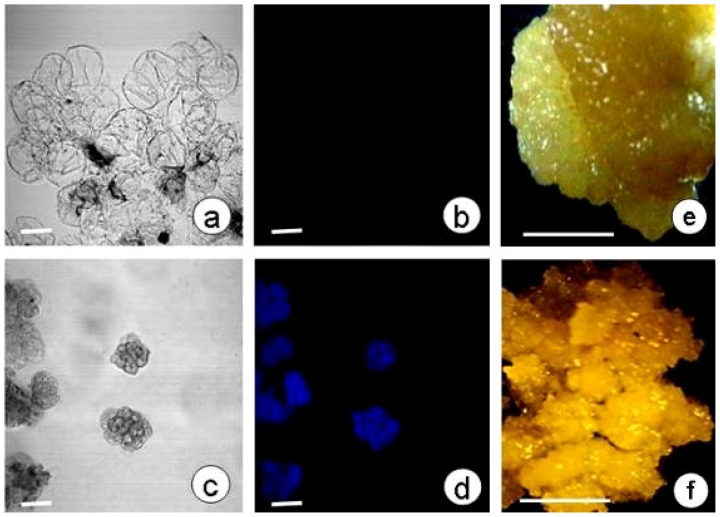
Figure 4.
Callose production in non-embryogenic and embryogenic calli. (a,b) Callose deposition was not observed in non-embryogenic calli. (c,d) Callose deposition was observed in embryogenic calli. Confocal laser scanning microscope bright-field images (a,c) and aniline blue fluorescent staining of callose (blue; b,d); scale bars 100 μm. (e,f) Light microscope images of a non-embryogenic callus (e) and embryogenic callus (f); scale bars 0.5 cm.

