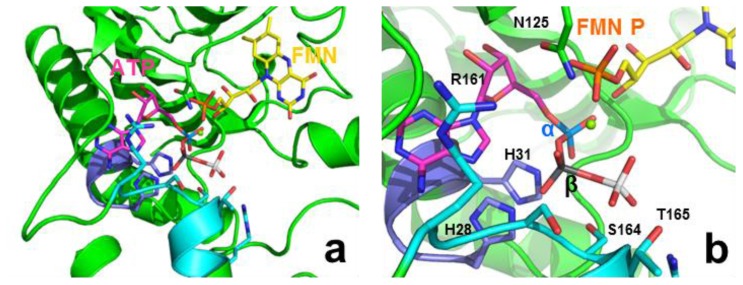
Figure 5.
(a) Putative positioning of ATP, Mg2+ and FMN substrates in the FMNAT-module of CaFADS. Structure produced by comparing the CaFADS crystal structure with those of the NMNAT from M. jannaschii (PDB code 1F9A) and M. thermoautotropicum (PDB code 1EJ2) in complexes with Mg2+: ATP and NAD+, respectively, and the FMNAT-module of Thermotoga maritima FADS in complex with AMP (PDB code 1T6Y). FMN and ATP are shown by sticks with carbons in yellow and magenta, respectively, while Mg2+ is shown as a green sphere. The phosphate of FMN is shown in orange, while those of ATP are in blue (α), grey (β) and white (γ). (b) Model showing a putative organisation of the different phosphate groups at the catalytic site.

