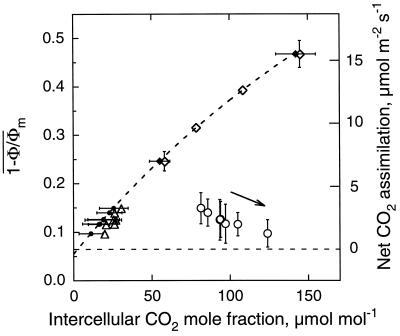
Figure 9.
Relationship between  and intercellular CO2 mole
fraction in 0.1% O2 before (⋄, ♦) and after (○, •,
Δ) ABA-treatment of a leaf of R. rubiginosa. (⋄,
○) are global Ci conventionally calculated
from gas exchange; (♦, •) are
C̄i calculated from the image
of Cii and (Δ) are Ci
predicted for gas exchange and calculated from
[(ḡt/1.6 −
Ē/2)Ca −
Ān]/[ḡt/1.6
+ Ē/2]. The experiment was the same as Figure 1.
Before the treatment, the relationship was obtained by varying the
external CO2 mole fraction. Fit was done according to
Equation 2 for data of global Ci (⋄). During
the treatment external CO2 was kept at 340 μmol
mol−1. The arrow indicates the temporal trend of the data
during the treatment. sds of
 and C̄i are
indicated by bars. The corresponding An scale,
computed from Equation 1 with k = 10.5 and
d = 0.055 and with An = A − R
and R = 0.35 μmol m−2
s−1, is shown on the right axis.

