Figure 1.
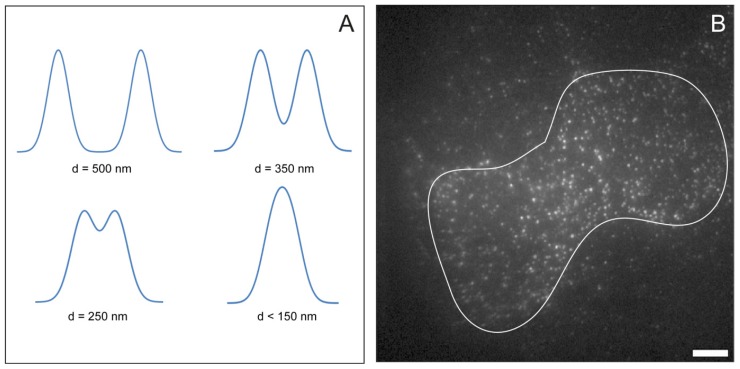
(A) Simulated intensity cross sections through a pair of single molecule fluorescence emitters with varying separations. Individual features can only be resolved when the molecules are separated by a distance greater than the point spread function of the microscope; (B) Single molecule TIRF image of EGFR in the plasma membrane of HeLa cells (expressing approximately 50,000 EGFR molecules per cell). EGFR are labelled with their ligand EGF, conjugated with the fluorophore Atto 647N (bar 8 μm). The white line shows the approximate cell borders.

