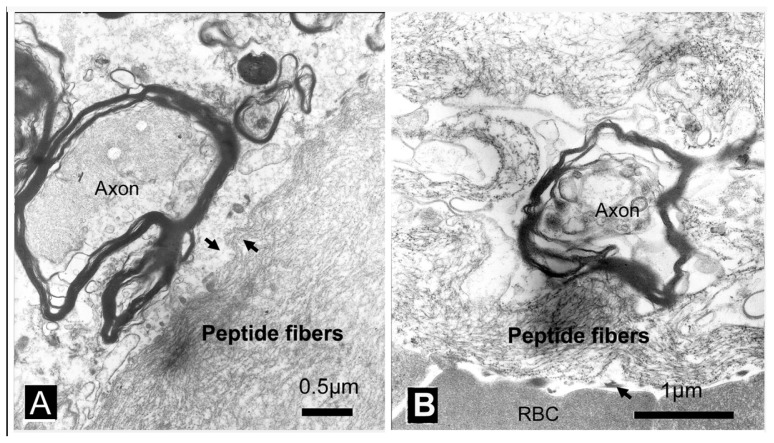
Figure 7.
Transmission electron microscopy (TEM) images showing the RADA16-1 nanofibers and interactions between RADA16-1 with tissues: (A) The cut in the spinal cord was treated with RADA16-1. Note the tight interactions between the irregular interfaces (black arrow). (B) A tiny vacant space presented between red blood cells (RBCs) and RADA16-1 nanofiber scaffolds at the interface (black arrow). Scale bar represents A = 0.5 μm, B = 1 μm.

