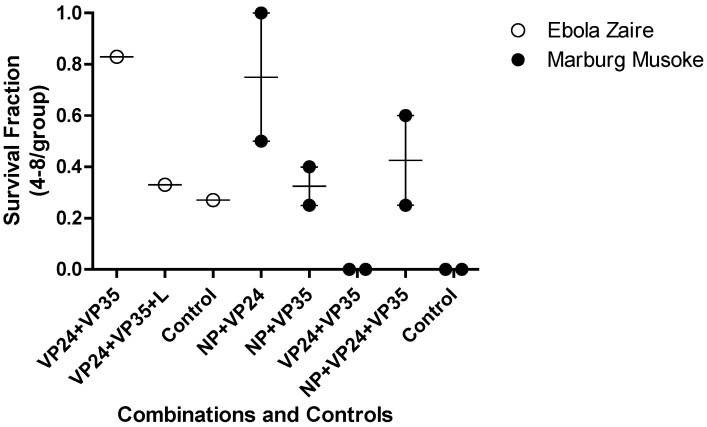
Figure 5.
Combinations of PMOplus Agents in the Guine Pig Models. The open circles represent individual studies with mice infected with mouse adapted Ebola virus. The filled circles represent individual study groups with mice infected with mouse adapted Ravn virus. The dose of each component oligomer was 0.05 mg/mouse so the total dose in the combination of three agents is larger than the dose for two agents.

