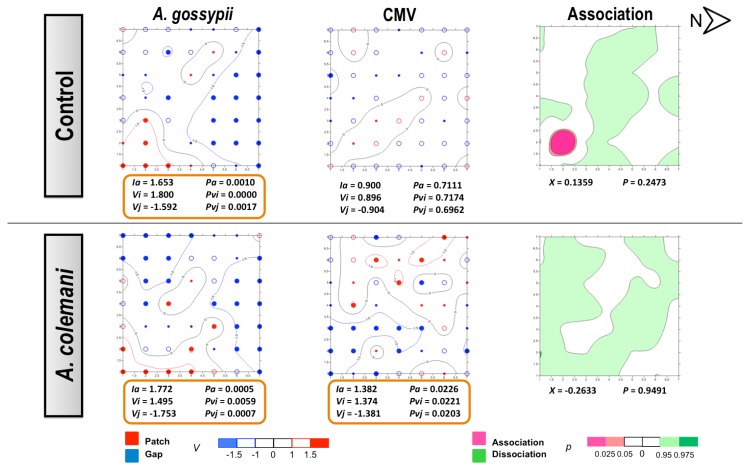
Figure 3.
Classed post maps of the spatial distribution of mean number of A. gossypii and cumulative number of CMV-infected plants (total number of infected plants per treatment) at 2 days, and contoured map of the association between CMV-infected plants and its vector, A. gossypii. Spots indicate individual test plants. Small filled spots represent clustering indices of 0 to ±0.99 (clustering below expectation), unfilled spots ±1 to ±1.49 (clustering slightly exceeds expectation) and large filled spots >1.5 or <1.5 (more than half as much as expectation). Red lines enclosing patch clusters are contours of v = 1.5 and blue lines are of v = –1.5. Black lines are zero-value contours, representing boundaries between patch and gap regions. The index of aggregation, Ia, the positive patch cluster index, vi, the negative gap cluster index, vj, and the index of spatial association, X, enclosed by an orange line are statistically significant. Letter N and arrow indicate north orientation.

