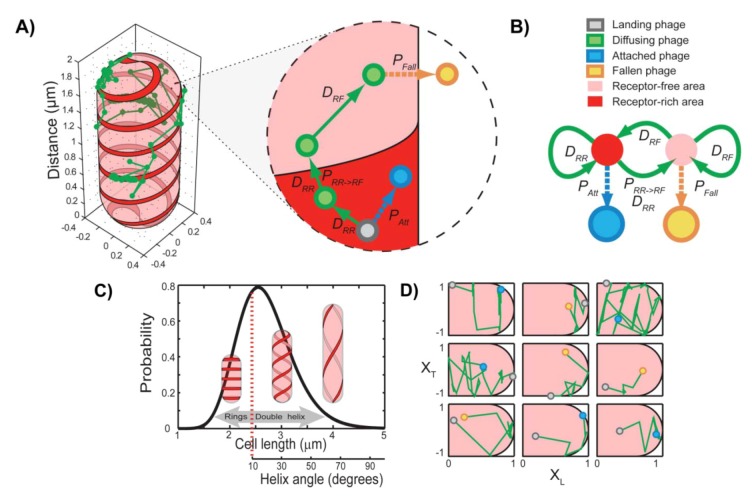
Figure 6.
Theoretical model of phage target finding. (A) A schematic description of the model, showing a typical phage trajectory (green) on the surface of an E. coli cell. Cell shape was modeled as a cylinder with hemispherical caps (radius Rc = 0.4 μm). The cell surface was divided into receptor-free (transparent pink) and receptor-rich (solid red) areas. The receptors form a 50-nm-thick double helical or multi-ring pattern along the cell surface. The zoomed-in area shows the kinetic scheme in detail. A phage located in a receptor-rich zone can either move within the receptor area with a stepsize consistent with the diffusion coefficient DRR, become attached with a probability PAtt (chosen to match the experimentally observed dwell time to attachment), or move into a receptor-free zone. This move can be rejected with a probability 1 − PNR → R, in which case the move will be repeated. On the other hand, a phage located in a receptor-free area can move with a diffusion coefficient DNR. If the phage attempts to enter the receptor zone, the move will always be allowed. The phage can also fall off the cell with a probability PFall = τsim/<τFall>, where τsim is the time step of the simulation and <τFall>, is the experimentally observed dwell time to fall-off in a LamB-E. coli strain. (B) A simplified kinetic scheme of the model, shown as a four-state, discrete-time Markov chain. The nonreceptor (NR) and receptor (R) states are transient, and the attachment (A) and fall-off (F) states are absorbing. (C) Generating population heterogeneity. Cell lengths were randomly chosen from a log-normal distribution spanning the experimentally observed cell sizes. The cell size defines the pitch of receptor double helix according to the relationship obtained experimentally. For short cells with helix angles of <10, a multi-ring pattern was used instead of a double helix. (D) Representative 2D projections of phage trajectories in normalized units (green lines). The initial landing site is shown as a gray circle. Panels in the first two rows display trajectories ending in attachment (blue circle), and panels in the last two rows display trajectories ending with the phage falling off the cell (at a position denoted with a yellow circle). Adopted and modified after [26].

