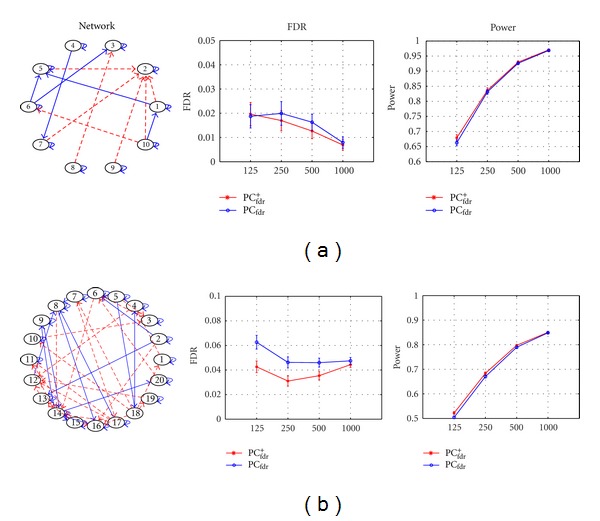
Figure 1.

Simulation results for the PCfdr + algorithm. (a) Simulation results for the network with 10 nodes and 23 edges. (b) Simulation results for the network with 20 nodes and 56 edges. In the networks, solid arrows represent edges from time t to t + 1, and dashed arrows represent edges with no time lag (i.e., from time t to t). For the FDR and detection power curves, the blue solid lines represent the PCfdr algorithm, the red solid lines represent the PCfdr + algorithm, the x-axis means the sample sizes, and the y-axis means the FDR or detection power.
