
Figure 2.
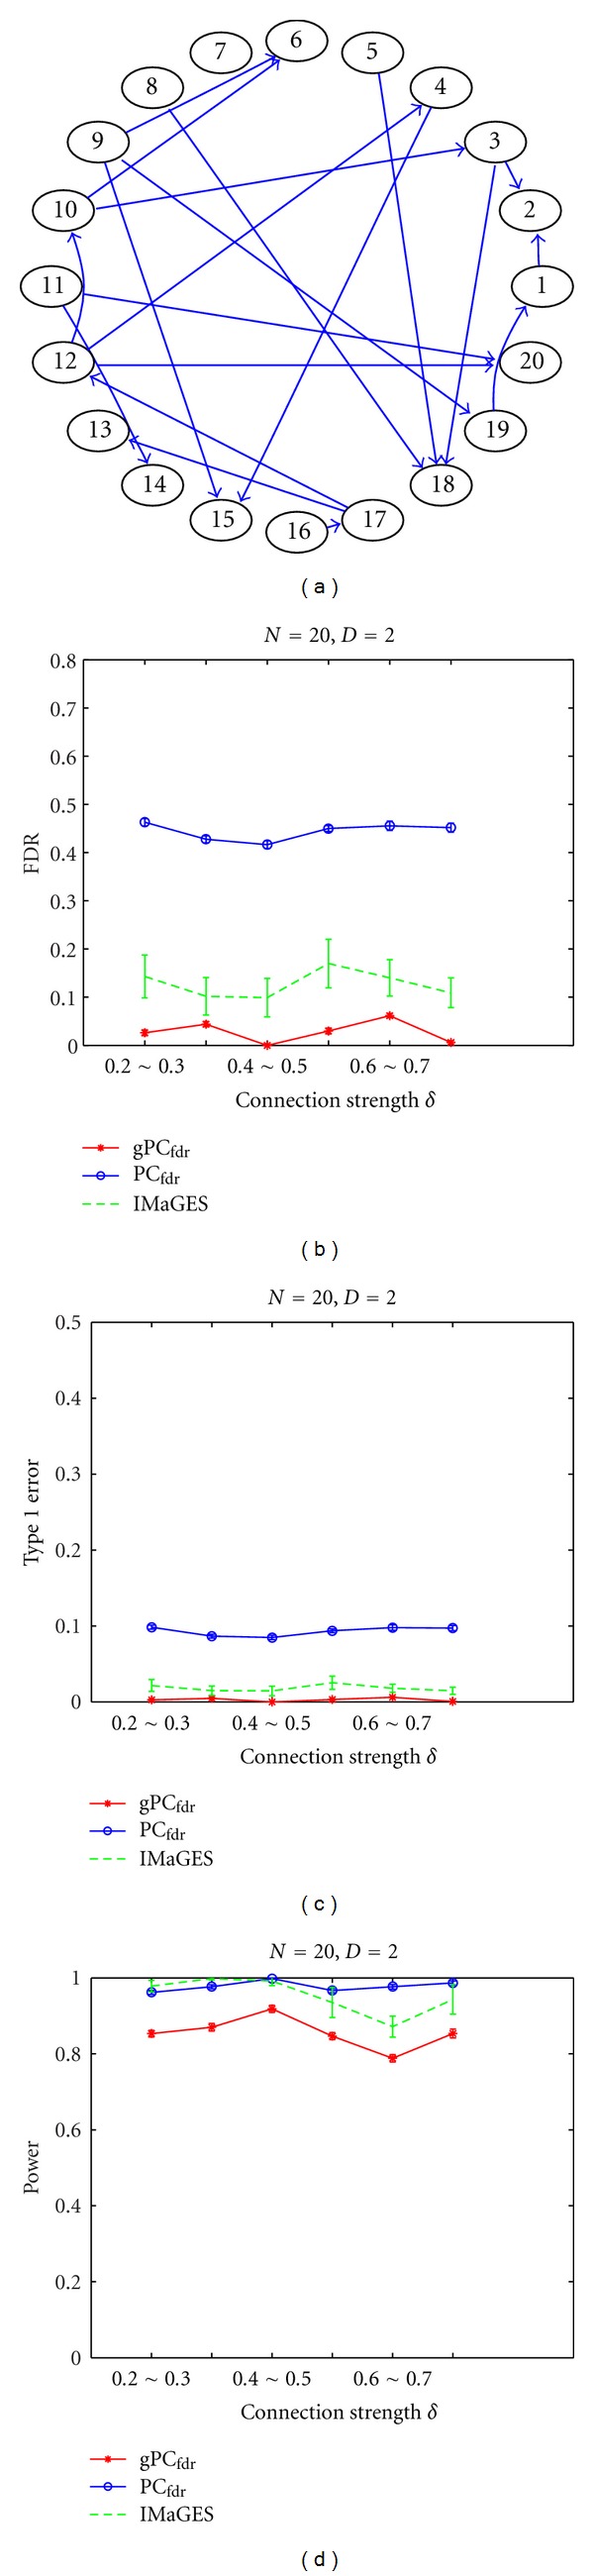
Simulation 1: assessing the effects of connection strength on the learned group networks. (a) The group-level network, with 20 nodes and an average of two connections per node. (b) The FDR curves (with standard deviation marked) of the gPCfdr algorithm, the original PCfdr algorithm by pooling all subject data together, and the IMaGES algorithm. (c) The type I error rate curves. (d) The detection power curves. The x-axis represents the generating distribution U(β 1, β 2) for sampling the connection coefficients.