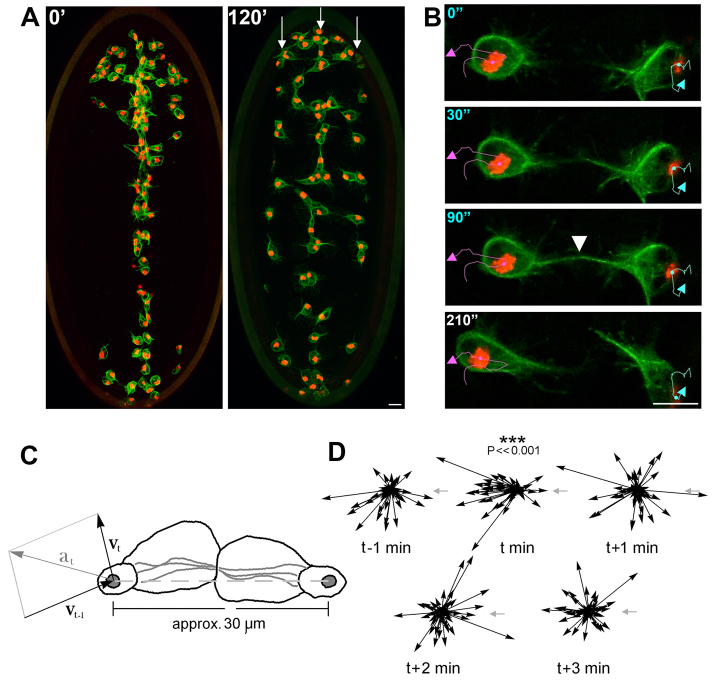
Fig. 1.
In vivo tracking of Drosophila haemocytes during contact inhibition. (A) A red fluorescent nuclear marker and a GFP microtubule label (green) were driven specifically in Drosophila haemocytes to observe acquisition of the three-line pattern (arrows). (B) Stills from a time-lapse movie of a haemocyte collision pair. Nuclei were tracked and the collision was defined by microtubule alignment (white arrowhead). (C) Sketch of colliding haemocytes at the moment of microtubule alignment (time t), illustrating how the acceleration vector at is calculated as its change in velocity vt–vt–1. Note that all vectors were oriented so that the cell on the right is in horizontal alignment with that on the left (dashed grey line). (D) Five samples of acceleration vectors surrounding a collision from t–1 to t+3 minutes. The x-components of the accelerations showed no significant bias to left or right except at the collision time t, when there was a highly significant bias away from the target cell [two-tailed t-tests: df=53, t-statistic=–1.68, –5.33, –0.69, 1.08, –1.34, respectively; P>0.05 except in the second case (collision time) when P<<0.001]. Scale bars: 10 μm.

