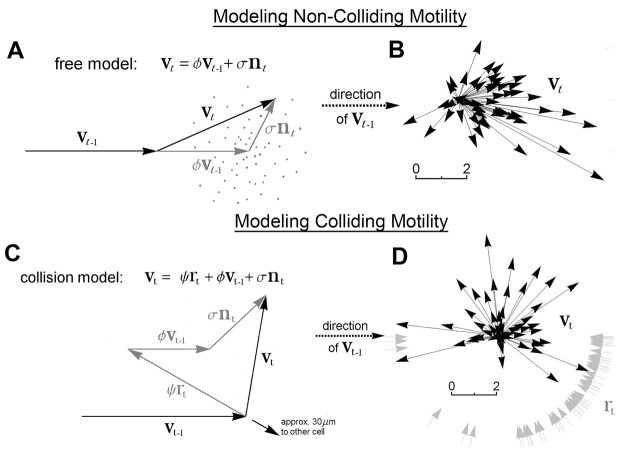
Fig. 2.
Mathematical modelling of non-colliding and colliding haemocyte motility. (A) Illustration of the successive velocities vt–1 and vt (black vectors) in the free motility model, showing how the dark grey vectors ϕvt–1 andσnt sum together to give vt in each iteration. Sinceσnt is a random noise vector, the cloud of grey points shows a sample of other possible end points for vt. (B) Sample of vt data from non-colliding haemocyte tracks where each pair of successive vectors (vt–1, vt) has been oriented so that vt–1 points to the right. Taking expectations of the x-components we get E[vxt]=ϕE[vxt–1]+σE[nxt]. Since we know that E[nxt]=0, the estimate of ϕ becomes ϕestimate=mean[vxt]/mean[vxt–1] and we obtained a value of 0.73. The two estimates ofσ are given by:σxestimate=s.d.[vxt–ϕestimate vxt–1] andσyestimate=s.d.[vyt]; these estimates, 1.44 and 1.06, were not significantly different at the 1% level [two-sided Fisher’s variance ratio test: variance ratio=1.86; df=(49,49), 0.05>P>0.01] and the mean of the two estimates (1.25) was used for simulations. (C) Illustration of the successive velocities vt–1 and vt (black vectors) in the collision model showing how the dark grey vectors ψrt, ϕvt–1 andσnt sum together to give vt in each iteration. (D) vt data from multiple collisions where each pair of vectors (vt–1, vt) has been oriented so that vt–1 points to the right. We first took expectations of the y-components: E[vyt]=ψE[ryt]+ϕE[vyt–1]+σE[nyt]. Since all aspects of the motility were expected to be symmetrical about the x-axis, these terms would normally vanish; however, we have biased the data by flipping some collisions about the x-axis so that all target cells (grey arrows) lie to the right of the oncoming cell. This resulted in two terms vanishing, leaving E[vyt]=ψE[ryt], which enabled us to estimate ψ as mean[vyt]/mean[ryt]. The estimated value of ψ (1.25) was next used to calculate new vectors, vt–ψestimate rt, which have the influence of the direction of the target cell removed. We used these modified vectors to estimate ϕ andσ by the methods used for the free motility model. We obtained an estimate for ϕ of 0.51, and the two estimates forσ (1.73 and 1.24) were again not significantly different at the 1% level [two-sided Fisher’s variance ratio test: variance ratio=1.94; df=(52,52), 0.05>P>0.01].

