
Fig. 3.
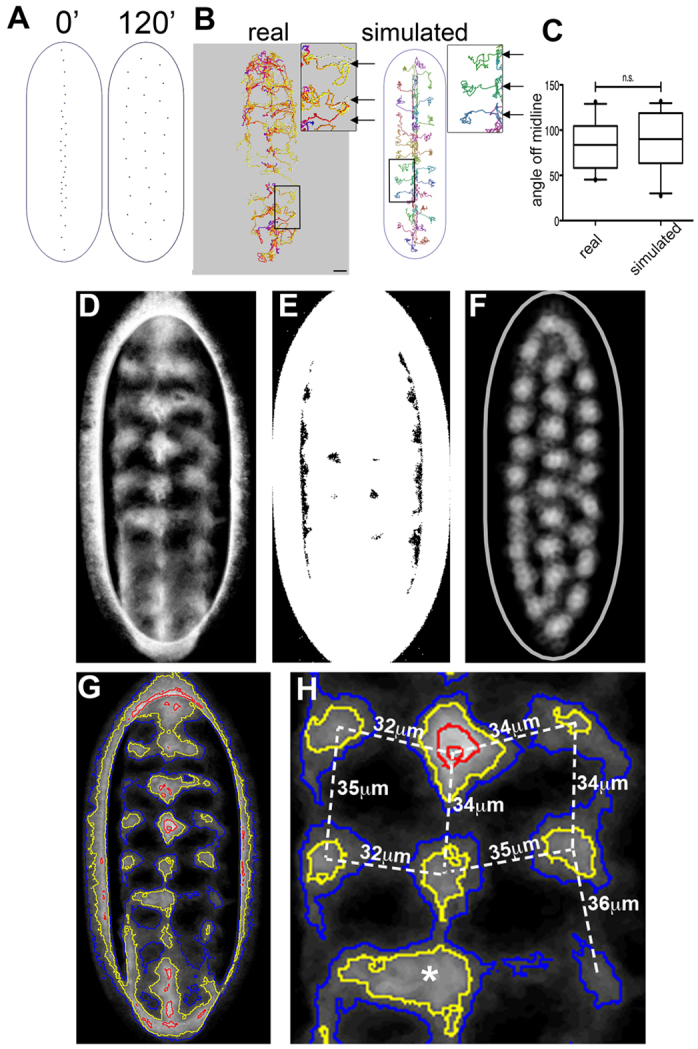
Simulated haemocyte dispersal recapitulates reality. (A) Haemocyte dispersal was simulated within a space of approximate geometry to real embryos. Cells were run down the midline for a period of 40 minutes before being allowed to freely disperse, when they rapidly developed a stable three-line pattern. (B) Real and simulated cells were tracked during the dispersal process. The insets highlight the repeating lateral movements (arrows) that emerged in both real and simulated cells. Scale bar: 20 μm. (C) Quantification of angles off the midline as cells migrate laterally revealed no significant difference (n.s.) between real and simulated cells (83±25° versus 87±31°, respectively; P>0.6, df=45, unpaired t-test). (D) A time-lapse movie (supplementary material Movie 5) was thresholded and flattened with a mean intensity to reveal the average spacing of haemocytes. (E) Flattening of the same movie with a maximum intensity revealed that haemocytes covered the entire surface of the embryo. (F) Domain maps from simulations were generated in the same way as from real cells using halos to approximate the actin region. (G) The domain map in D was analysed by contour plotting to reveal the peaks of the haemocyte domains. (H) The distance between the haemocyte domains was ∼34 μm. The asterisk indicates a breakdown in the haemocyte domain pattern, which was analysed further in supplementary material Movie 10.