
Fig. 4.
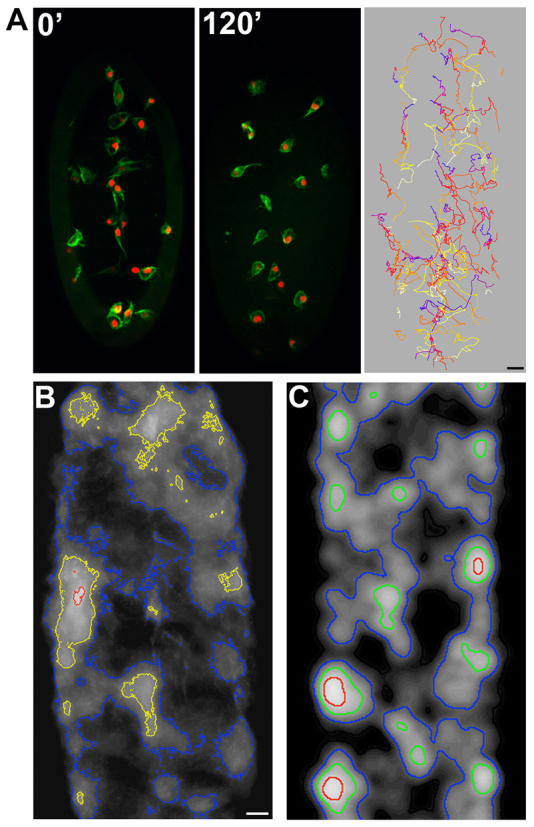
Reduction of cell number prevents pattern development. (A) Example embryo containing haemocytes overexpressing Cyclin A, along with a red nuclear marker and GFP-labelled microtubules. Cells were tracked for 2 hours as they developmentally dispersed. Right-hand panel shows cell tracks over the duration of the time-lapse movie. (B) Contour plot of a domain map of Cyclin A-expressing haemocytes containing labelled actin (generated from supplementary material Movie 14). (C) Contour plot of a domain map of a simulation containing half the number of cells as found in wild type. Scale bars: 10 μm.