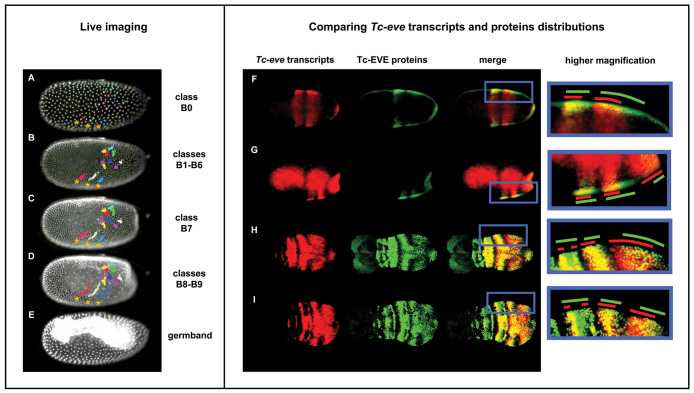
Fig. 3.
Tc-eve waves are due to transcription dynamics, rather than cell movements. (A-E) Stills from live imaging of an EFA-nGFP transgenic Tribolium embryo (supplementary material Movie 2), from early blastoderm (A) to germband (E) stages; the corresponding Tc-eve patterns from Fig. 2 are indicated on the right. Colored circles track the movement of nuclei, showing that cell movement cannot explain Tc-eve dynamics. Three dorsolateral cells are marked with asterisks in A-D. (F-I) Concurrent Tc-eve in situ hybridization (red; first column) and Tc-EVE antibody staining (green; second column) were merged (third column) to reveal the phase shift between mRNA and protein distributions. The fourth column shows higher magnifications of the region of interest; red and green lines mark the extent of Tc-eve transcript and Tc-EVE protein distributions, respectively. The fact that Tc-EVE stripes lag behind those of Tc-eve indicates that Tc-eve stripes propagate as waves from posterior to anterior. The fact that the phase shift decreases as the stripes mature suggests that the waves are slowing down before they eventually freeze and split into secondary stripes. Similar dynamics are seen at different stages. Anterior to the left; ventral is up in A-E.

