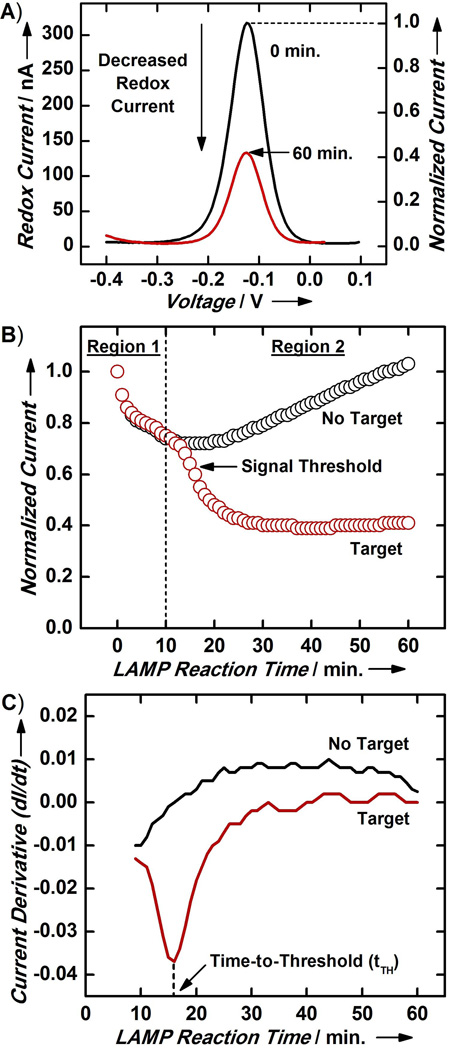
Figure 2. Electrochemical Monitoring of MEQ-LAMP.
(A) The on-chip electrochemical measurement module readily detects MB-LAMP amplification of S. Typhimurium target genomic DNA. All current measurements are normalized to the initial current measurement (i.e., 0 min.) to account for chip-to-chip variations. (B) Normalized real-time current traces for a negative control (no DNA) sample and sample containing S. Typhimurium genomic DNA exhibit clear differences. Only the latter displays a sharp current decrease in Region 2 of the current trace. The amplification kinetics in this second region shows a sigmoid behavior, similar to typical real-time PCR and real-time LAMP kinetics. We designate the point of highest reaction efficiency (steepest decrease in current) as the signal threshold. (C) By taking the derivative of the current trace, the signal threshold is revealed as the local minimum in the curve, facilitating reliable determination of the time-to-threshold (tTH, vertical dashed line), defined as the reaction time required to reach the signal threshold.

