Figure 7.
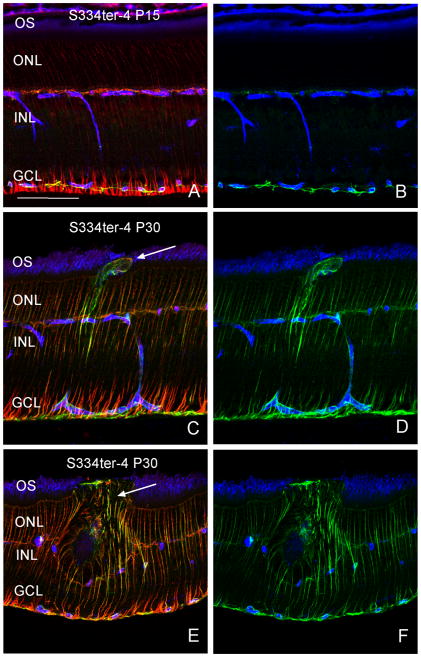
Glial cell activation. Panels B, D, and F are identical to A, C, and E, respectively, with the red channel removed. At P15 in Tg retinas, Müller cells show little evidence of activation with either GFAP (green) or Vimentin (red; Fig. 6A, B). However, at P30, both proteins were upregulated in Müller cells and often outgrowths from Müller cells were observed extending past the outer limiting membrane into the OS layer (Fig. 6C, D, arrow). A glial scar is observed (Fig. 6E, F, arrow). Scale bar: 100 μm.

