
Figure 2.
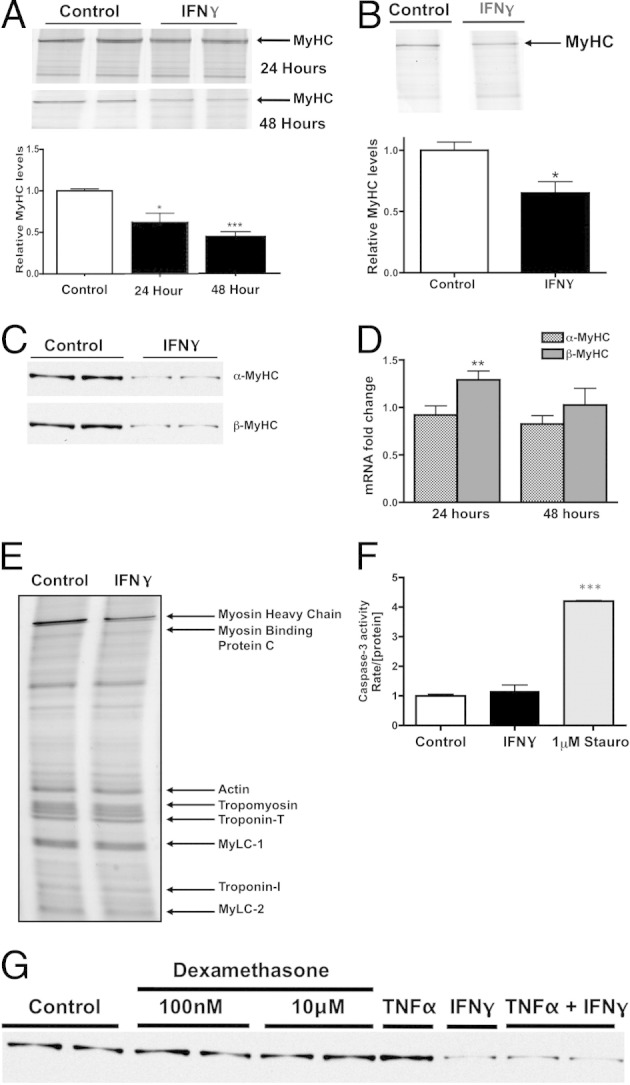
IFN-γ induces a specific decrease in MyHC protein. A: Top panel: Representative myofibrillar gel of protein lysates obtained from NRVMs treated with vehicle (control lanes) or 200 U/mL IFN-γ for 24 or 48 hours. Bottom panel: Densitometric quantification of MyHC band intensities, normalized to vehicle-treated cells. B: Top panel: Representative myofibrillar gel of protein lysates treated with vehicle (control lane) or 0.2 U/mL IFN-γ for 24 hours. Bottom panel: Densitometric quantification of MyHC band intensities, normalized to vehicle-treated cells. C: Representative Western blots using antibodies raised against α-MyHC and β-MyHC in NRVMs treated with vehicle or IFN-γ. D: Quantification of α-MyHC and β-MyHC gene expression in NRVMs treated with IFN-γ for 24 or 48 hours. E: Representative myofibrillar gel of protein lysates obtained from NRVMs treated with vehicle or IFN-γ. Bands representing sarcomeric proteins are as indicated. MyLC, myosin light chain. F: Caspase activity in NRVMs treated with vehicle, IFN-γ, or 1 μmol/L Staurosporine (Stauro) for 48 hours. The rate of caspase activity was normalized to the concentration of protein in each sample (n = 2 preparations). G: Representative Western blot using antibodies raised against cardiac MyHC in NRVMs treated with IFN-γ, TNF-α, dexamethasone, or vehicle. Samples are on the same gel but the last four lanes are noncontiguous. *P < 0.05, **P < 0.01, and ***P < 0.001 compared with control.