
Figure 6. Role of Type I IFN Signaling in TLR-Induced Changes in Costimulatory Molecule Expression.
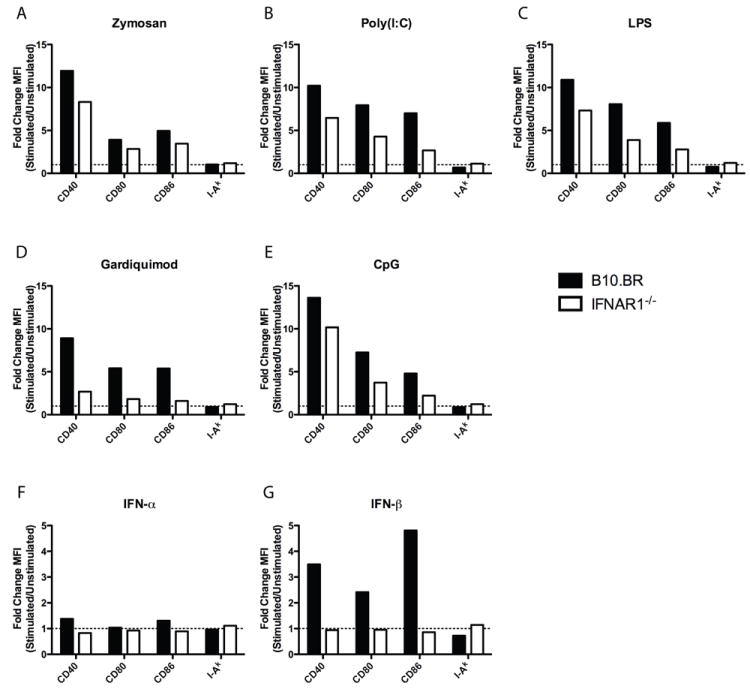
DC from wild type B10.BR or IFNAR1-/- mice were incubated alone or with (A) Zymosan, (B) Poly (I:C), (C) LPS, (D) Gardiquimod, (E) CpG, (F) IFN-alpha, or (G) IFN-beta for 18 hours. DC were stained for CD40, CD80, CD86, or I-Ak and analyzed by flow cytometry. Data represented as fold change MFI of stimulated over un-stimulated DC. Data gated on live CD11chigh Siglec H- cells. Data are representative of two independent experiments. Full histograms are shown in Figure S2.