
Figure 7. Role of H2-DM Regulation in TLR-Induced Type B pMHC Presentation from HEL and Accelerated Catabolism in CpG-B-Activated DC.
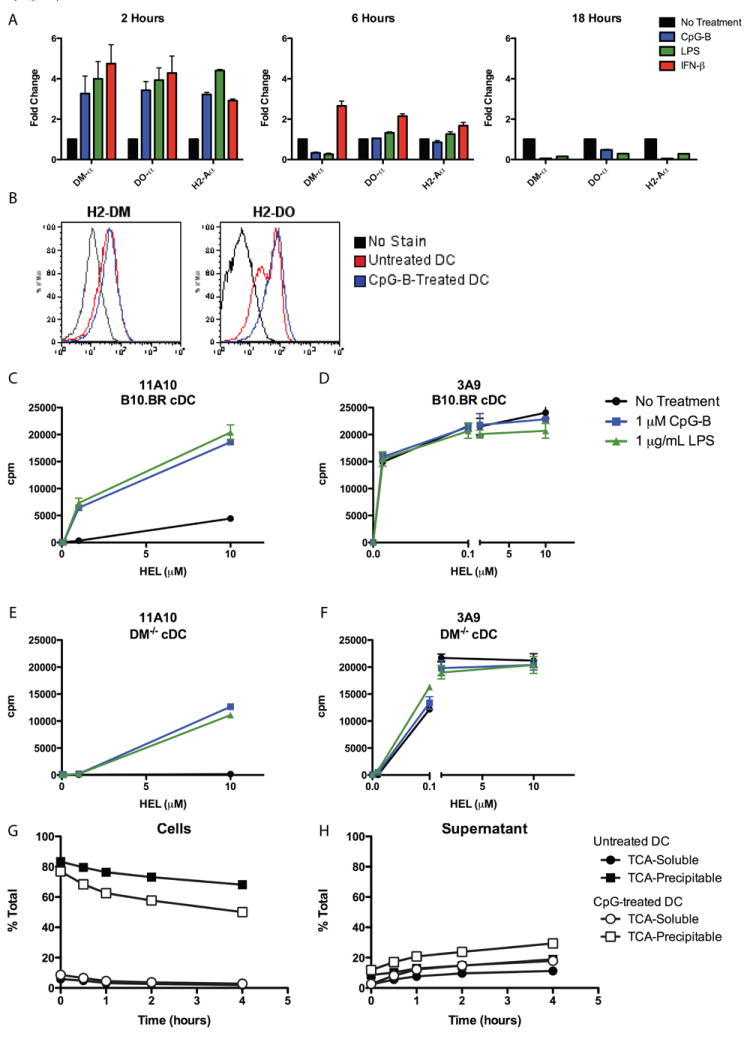
(A) qRT-PCR analysis of RNA isolated from sorted cDC (CD11chighSiglecH-CD19-) were incubated with stimulants for 2, 6, or 18 hours. (B) Intracellular flow-cytometry analysis of H2-DM and H2-DO protein levels in sorted cDC after 18 hours of stimulation. (C-F) Presentation to (A, E) type B 11A10 or (B, D) type A 3A9 by sorted (C, D) wild-type B10.BR or (E, F) H2-DM-/- cDC incubated with HEL protein with or without stimulants. (G, H) DC were incubated for 18 hours with or without CpG-B, washed, incubated with I125-HEL for two hours at room temperature, washed extensively, then chased for indicated times at 37°C. TCA-Soluble and TCA-Precipitable fractions were collected from the (G) intracellular and (H) supernatant fractions. Data plotted as percentage of total cpm at each time point.