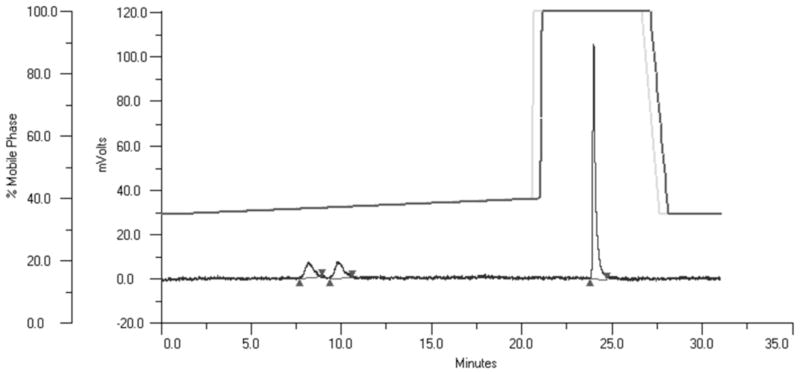
Figure 2.
Representative BoNT/A LC HPLC assay. The upper lines represent the programmed and actual gradients and the lower line the absorption at 365 nm of the HPLC effluent. The peak at ≈24 min represents the intact peptide while the peaks at ≈ 8 and 10 min represent the N -terminal and C -terminal pieces of the peptide, respectively.

