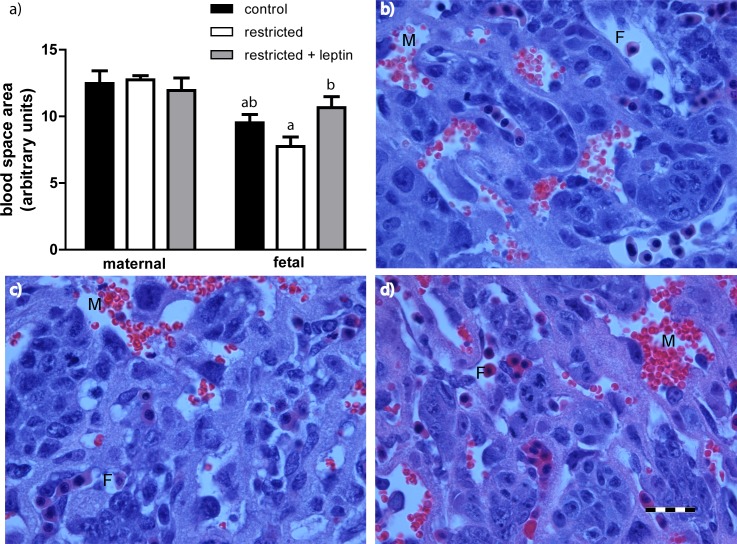
FIG. 3.
a) Average cross-sectional area of fetal and maternal blood spaces within three randomly selected images of the labyrinth zone from three placentas per mother (control, n = 8; restricted, n = 7; restricted + leptin, n = 6). Bars with different letters are significantly different (Tukey multiple comparison test). Representative images of blood spaces from control (b), restricted (c), and restricted + leptin (d) placentas. F, fetal blood space (distinguished by nucleated red blood cells); M, maternal blood space. Bar = 50 μm.

