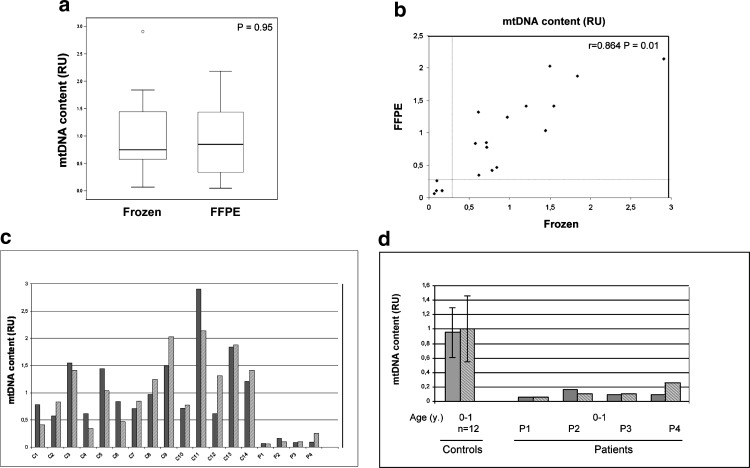
Fig. 2.
Comparative analysis of mtDNA content in frozen and FFPE muscle biopsies. (a) Similar levels of mtDNA were found in frozen and FFPE samples as determined by the Wilcoxon ranked test. (b) Spearman test showed statistically significant correlation between FFPE and frozen paired samples. Dotted line separates tissues with confirmed mtDNA depletion and delimits the threshold for mtDNA depletion (30% of mtDNA content in control samples). (c) mtDNA content in frozen and FFPE paired samples. C1–C14 correspond to control samples and P1–P4 to patients with previously confirmed mtDNA depletion. Results are shown in relative units (RU). Gray bars indicate frozen tissue, striped bars indicate FFPE samples. (d) Comparison of the mtDNA content of the four patients (P1–P4) with age-matched controls. Results are shown in relative units (RU). Gray bars indicate frozen tissue, striped bars indicate FFPE samples. Error lines represent the mean ± standard deviation

