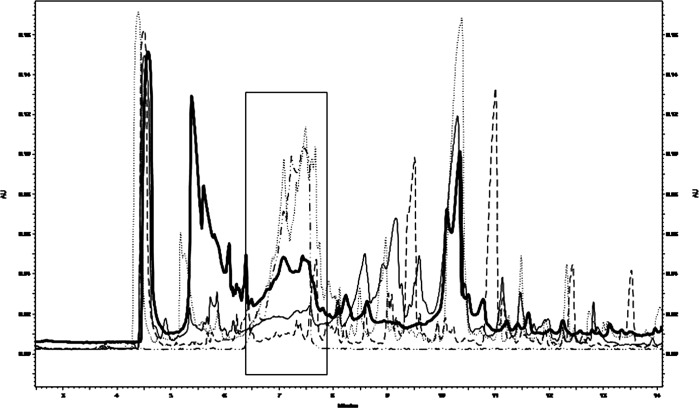
Fig. 3.
Representative overlapped CE electropherograms of urine samples; the frame represents the time window where dipeptides migrate. From bottom to top: healthy age/gender-matched control, donor patient’s brother urine, posttransplant patient’s urine (corresponding to the second collection posttransplant), standard dipeptide mixture, pretransplant patient’s urine (dotted line)

