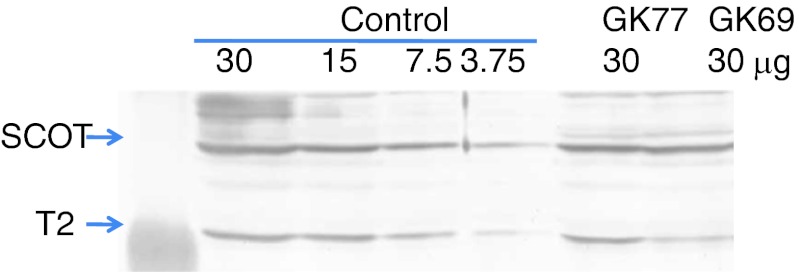
Fig. 1.
Immunoblot analysis. In the cases of the controls, serial twofold dilutions from 30 to 3.75 μg were studied together with samples (30 μg) from GK68 and GK77. The first antibody was a mixture of an anti-T2 antibody and an anti-SCOT antibody. The positions of the bands for T2 and SCOT are indicated by arrows

