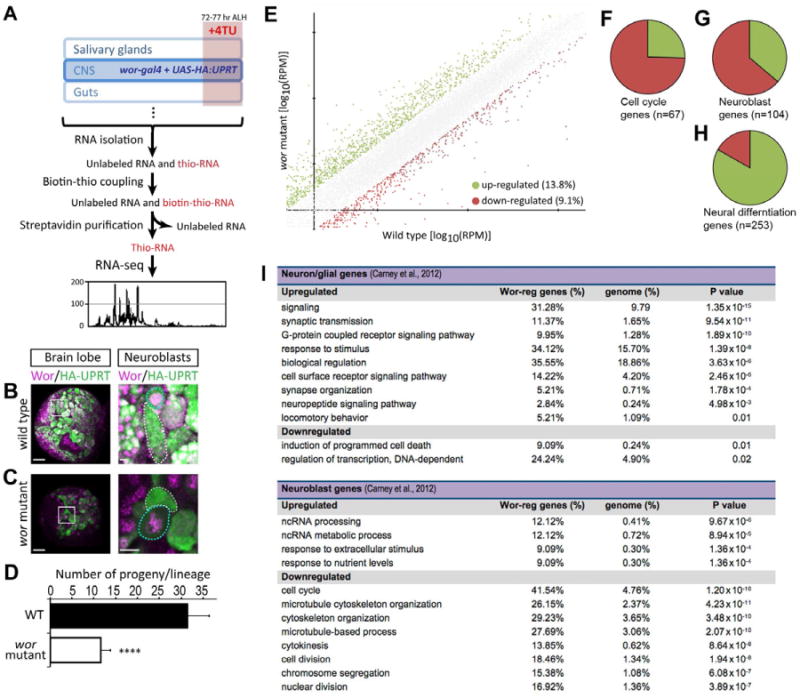
Figure 1. TU-tagging/RNA-seq shows that wor mutants downregulate neuroblast genes and upregulate neuronal differentiation genes.

(A) Scheme of TU-tagging processes for transcriptome analysis. 4TU: 4-thioruacil.
(B-D) Wild type and wor mutant NBs both express HA-tagged UPRT (HA:UPRT) in third instar larvae. In both B and C, the left panel is a low magnification view of a brain lobe (scale bar, 20 μm) with the boxed region shown at high magnification (scale bar, 5 μm) in the right panels. HA:UPRT is expressed in NB (cyan dotted circles in the right panels) and persists in the new born neuroblast progeny (dotted white circles in right panels); quantified in D. ****, p-value < 0.0001. Small Wor+ cells adjacent to neuroblasts are newborn GMCs.
(E)Log to the base 10 of fold of gene activities in wt and wor mutants. Green dots are genes upregulated more than 2 fold; red dots are genes downregulated more than 2 fold.
(F)Pie chart represents the 67 of the 586 Drosophila “cell cycle” annotated genes(GO:0007049) that are differentially regulated in wor mutants (> or < 2-fold change); the majority are down-regulated (75%; red) and a minority are upregulated (25%; green).
(G-H) Pie charts represents the “neuroblast” genes or the “neuron differentiation” genes from Carney et al. (2012) that are differentially regulated in wor mutants (> or < 2-fold change). The majority of the 253 “neuron differentiation” genes are up-regulated (85%; green); whereas the majority of the 104 “neuroblast” genes are down-regulated (66%; red).
(I) GO terms that whose frequency is over-represented in wor upregulated (> 2-fold) or wor downregulated (< 2-fold) genes compared to their frequency in the genome. Only genes within the “neuron differentiated” (top) or “neuroblast” (bottom) gene lists from Carney et al. (2012) are analyzed.
See also Figure S1, Table S1, S2.
