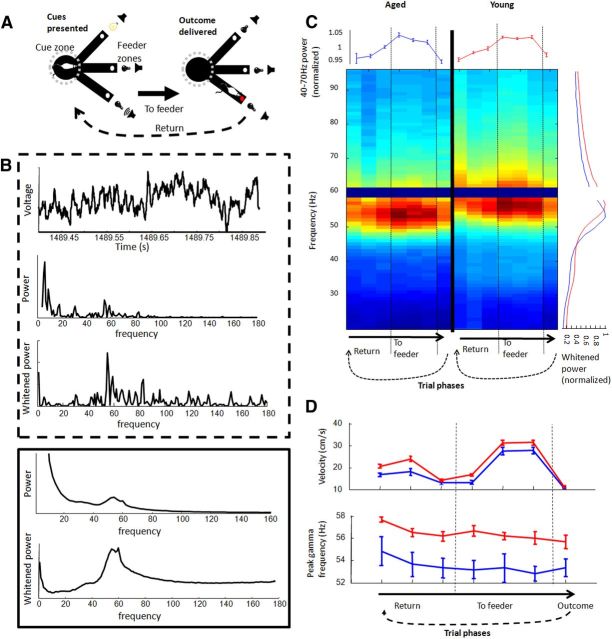
Figure 1.
Gamma frequency between trial phases and age groups. A, Rats performed a decision task on a raised, three-armed platform. When a rat entered the central zone, an auditory and a visual cue was presented from the ends of randomly selected arms (left). If the rat correctly navigated to the end of the arm with the rewarded cue, it received liquid food reward (right); if an incorrect choice was made, an error sound was presented. Neural data on the task was normally analyzed after binning trials into seven 500-ms phases (detailed in Materials and Methods). B, LFP and spectral data from an example 500 ms block as a rat performed the decision task (within top dashed line) and average spectral data across all trials and sessions from all rats (within bottom solid line). The three panels in the top window display the raw LFP trace, the frequency spectrum of the trace, and the same frequency spectrum after applying a whitening filter. The two panels of the bottom window display averages before and after applying a whitening filter. Both the example and averages reveal a strong signal in the 40–70 Hz band peaking ∼55 Hz. C, Whitened power spectrum across trial phases. Spectral frequency (y-axis) is averaged across trials and sessions, normalized by peaks and then averaged across rats for the seven 500-ms trial phases (x-axis). Vertical dashed lines between columns in the figure indicate the time of cue initiation and outcome delivery. The gap at the 59–61 Hz band represents its removal from analyses. Right edge graph displays power spectra averaged across trial phases (aged, blue; young, red). Top edge graph displays normalized mean gamma amplitude for each trial phase. Frequency of peak gamma was significantly lower in aged rats across all trial phases. D, Although the speed that rats were moving was highly dependent on trial phase (top), gamma frequency exhibited only minor variations across trial phases (bottom), and these variations were identical between age groups (aged, blue; young, red).

