
Figure 10.
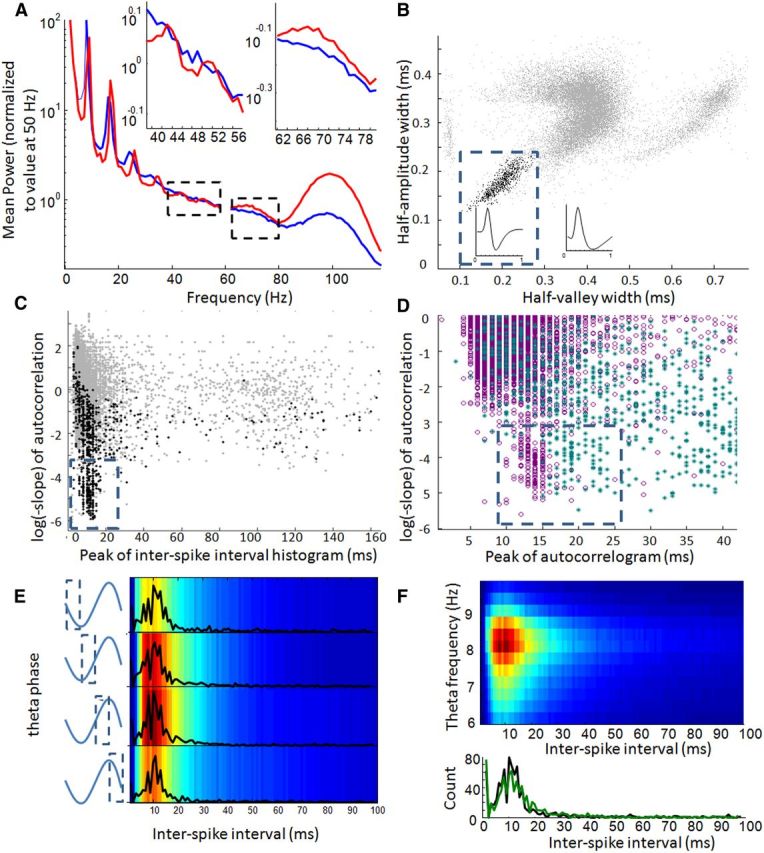
Gamma patterns in LFPs and putative inhibitory neurons from hippocampal region CA1 of young and aged rats. A, Average spectrograms for hippocampal LFP data collected from aged (blue) and young (red) adult rats. Spectral data were computed for a specific segment of each trial, were averaged across trials, and then averaged across four sessions for each rat. For display purposes, within-rat averages were normalized by the power at 50 Hz before data were averaged within age groups. Left and right insets provide an expanded view of the age-group differences between 40–60 and 60–80 Hz, respectively (outlined by dashed-line boxes in main plot). Sharp spectral peaks in the theta (6–10 Hz) band in both age groups appear to reoccur at exponentially reduced amplitudes at theta harmonics (note the log-scale vertical axis). The shifted theta frequency in older rats reflects differences in average running speeds and appear to be reflected by similar shifts at the theta harmonics. In contrast with data from the cingulate, no gamma-band power increases appear to dominate below 60 Hz, although strong power increases are apparent between 60–80 and 90–110 Hz. B, The half-amplitude width of the average waveform of each hippocampal neuron is plotted against the half-valley width (gray points). The dashed line shows the approximate boundaries used to define putative inhibitory neurons (black points). Trace displayed within the dashed box is the average waveform of all neurons within the cluster, and the trace outside the box is the average waveform of all other neurons in the population. C, Autocorrelation slope versus interspike interval peak of all neurons (gray points) as well as cells identified as putative inhibitory neurons (black points). As with neurons in frontal cortex, a subpopulation of neurons exhibited flatter slopes and early peaks; these neurons were classified as fast spiking (outlined by dashed line). D, Autocorrelation slope and autocorrelation peak latency are plotted for all recorded hippocampal (purple) and frontal (cyan) neurons. The latencies between spikes in hippocampal fast-spiking neurons are consistently earlier (12–13 ms) than those of frontal cortex (18–20 ms). Also in contrast with frontal neurons, no age differences were observed between the hippocampal fast-spiking neuron, autocorrelation peaks (data not shown). E, Distribution of interspike intervals of all (aged and young adult) hippocampal putative inhibitory neurons across four phases of theta. Average histograms of 1-ms-binned interspike intervals across all inhibitory neurons (colors) and frequency plots of histogram peaks (overlaid black traces) display variation in average firing rates across theta phases (y-axis) but very little variation in the interval between spike pairs (x-axis). F, Interspike interval histograms of all putative inhibitory neurons (aged and young adult) averaged within 12 frequency bins between 6 and 10 Hz (y-axis). Hotter colors in top represent increased occurrence of sequential spike pairs occurring at a given theta frequency (y-axis) with a given interspike interval (x-axis). Although neurons typically fired when theta frequency was between 7.5 and 9 Hz, changes in the shape of interspike interval histograms across theta frequencies were minor. Bottom shows the frequency distribution of interspike interval histogram peaks when theta oscillated at 7 Hz (black trace) compared with when theta oscillated at 9 Hz (green trace). In both cases, the central tendency of the distribution was at 11 ms.